Report “Pages”
The Pages report shows the current state and trend of the speeds of the measured URLs.
It answers questions such as:
- How fast are the measured URLs right now, and how is that evolving?
- Have optimizations on specific URLs paid off?
- Which pages have the greatest impact on changes to the domain’s overall speed?
The Pages report is an advanced tool. It’s aimed at developers and other speed optimizers who want to dive deeper into site performance. For website owners and other managers, the Domain report is often more suitable.
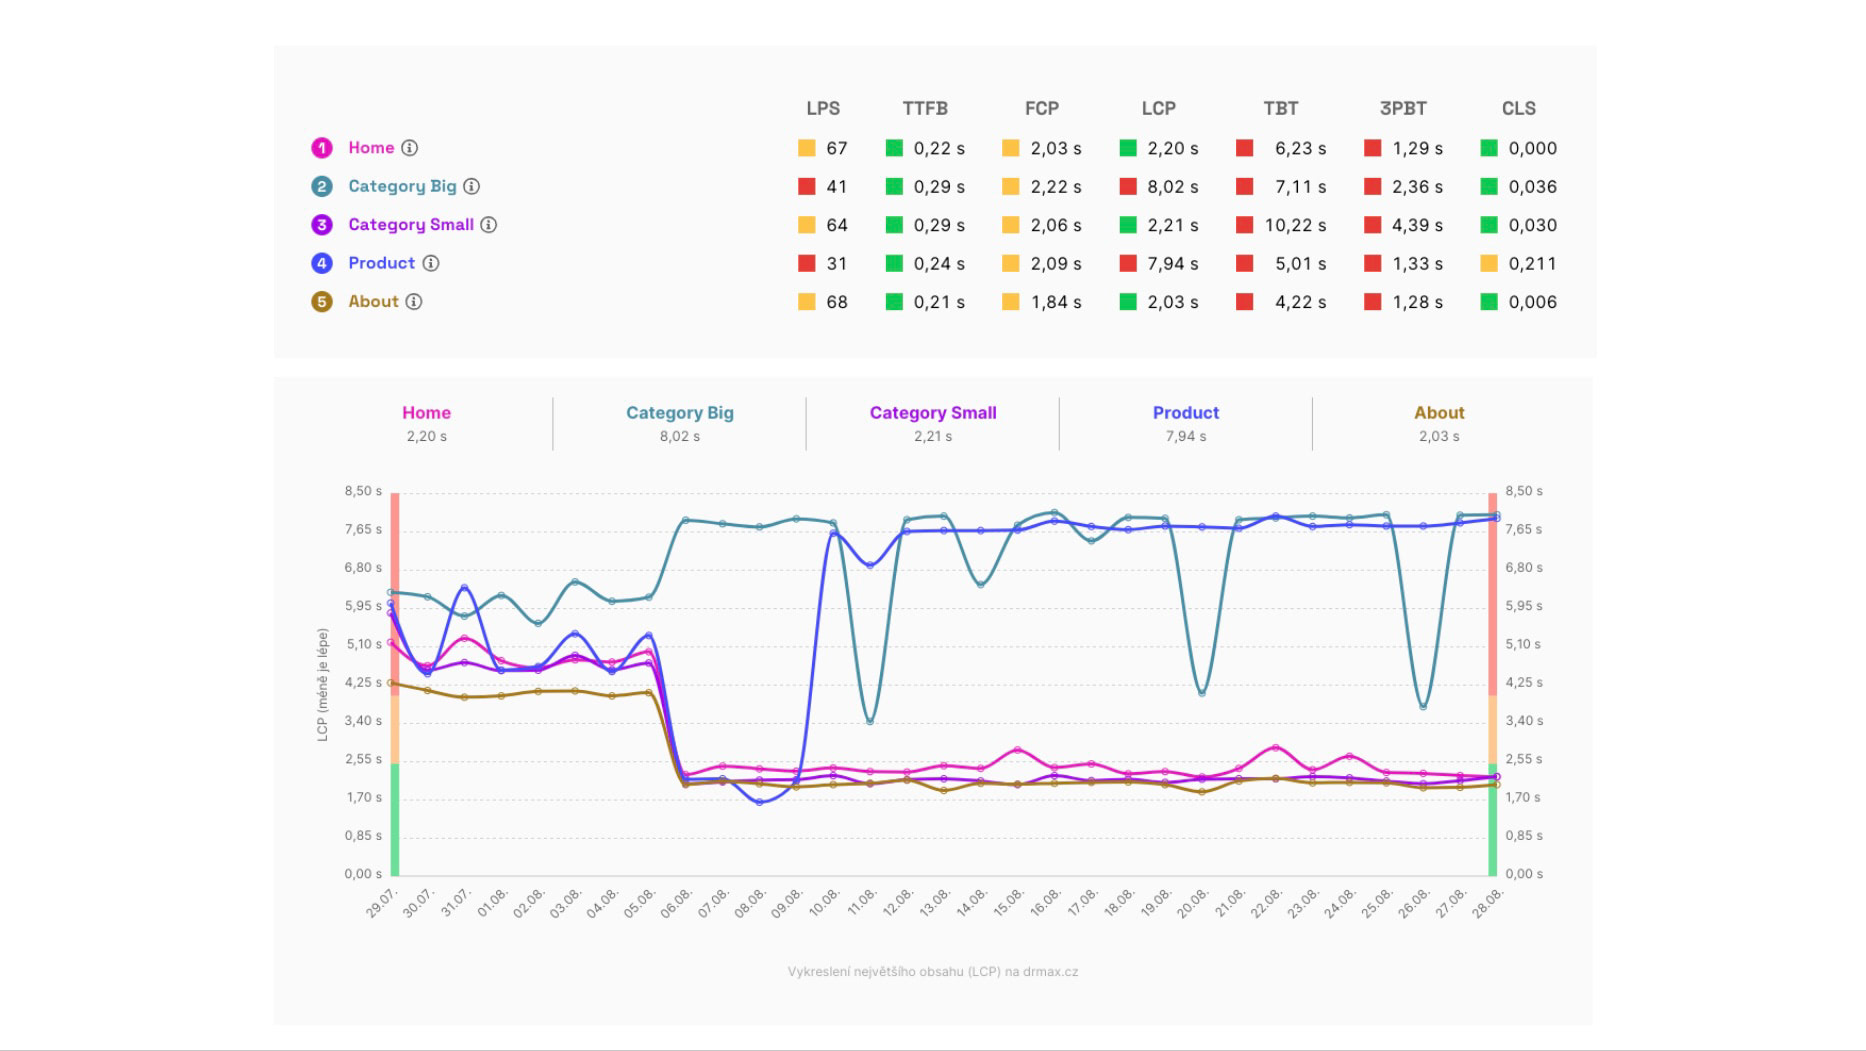 Status of synthetic metrics (top) and the evolution of the Lighthouse Performance Score (LPS) for one of the tested sites.
Before you dive further, keep in mind the following:
- It’s important to understand the differences between the various speed measurement types. In the Pages report we work with data from synthetic measurements and from Google users (CrUX).
- You should also know how we measure web speed in our monitoring.
- We strongly recommended properly configuring the pages to measure.
- It’s helpful to know how the Domain report or the Watchdog works.
Ready? Let’s continue.
Watchdog vs. Domains vs. Pages
First, let’s clarify how these three major reports relate in our speed monitoring.
Watchdog tracks the speed of the URLs you configure, and will alert you if there’s an improvement or deterioration. Watchdog uses synthetic data, so the numbers are very up-to-date, but may not be perfectly precise.
The Domains report cannot alert day-to-day changes because it uses data from the Chrome UX Report (CrUX). Those data, however, are highly accurate, so every Watchdog alert should be cross-checked against CrUX. We don’t know which exact parts of the site changed from Google user data.
The Pages report doesn’t report changes itself, but after each Watchdog alert it lets you see which specific URLs caused the changes.
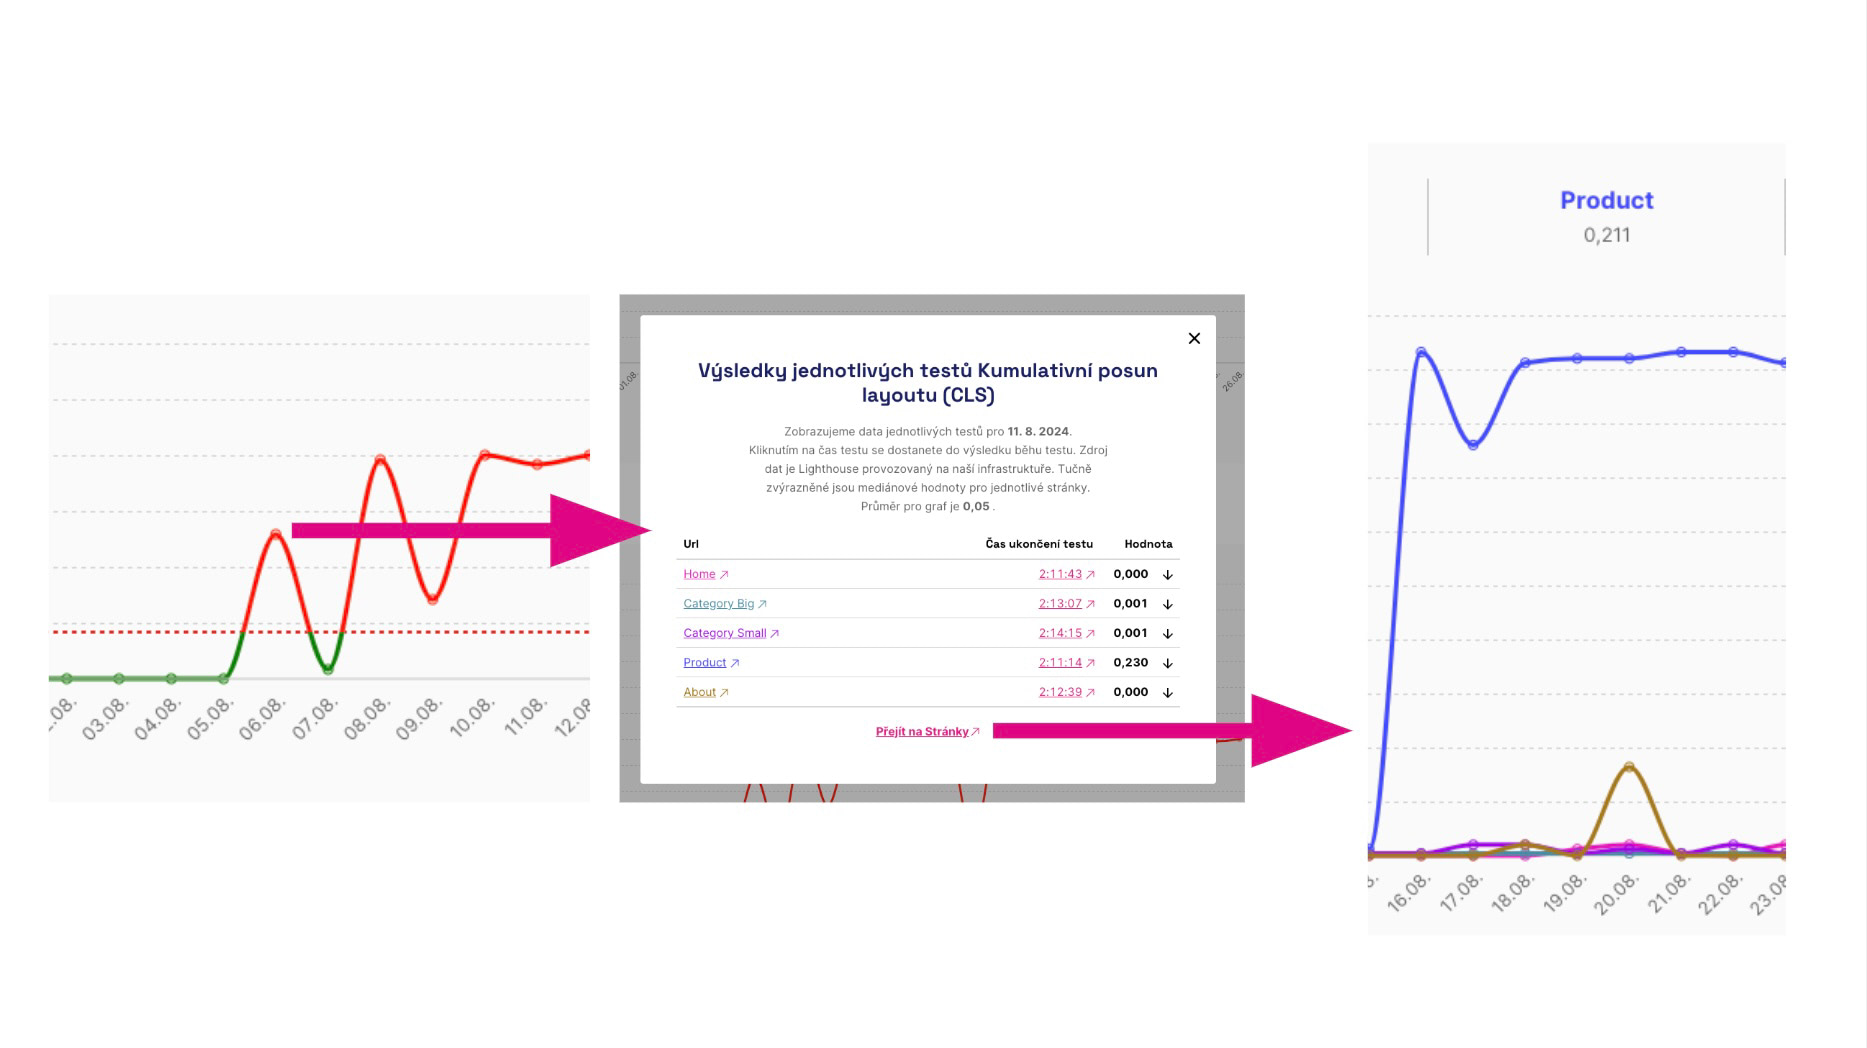 How to drill down to the problematic page slowing you down? In Watchdog, click the chart, then in the modal window follow the link to the Pages report.
The Pages report shows the status and evolution of metrics for all measured URLs, including both synthetic metrics and Google user data (CrUX).
🔐 Google CrUX data for pages is available only in the SPEED MONITORING PLUS plan.
What if some URLs lack user data?
Data for some URLs is frequently unavailable or only available for a limited period.
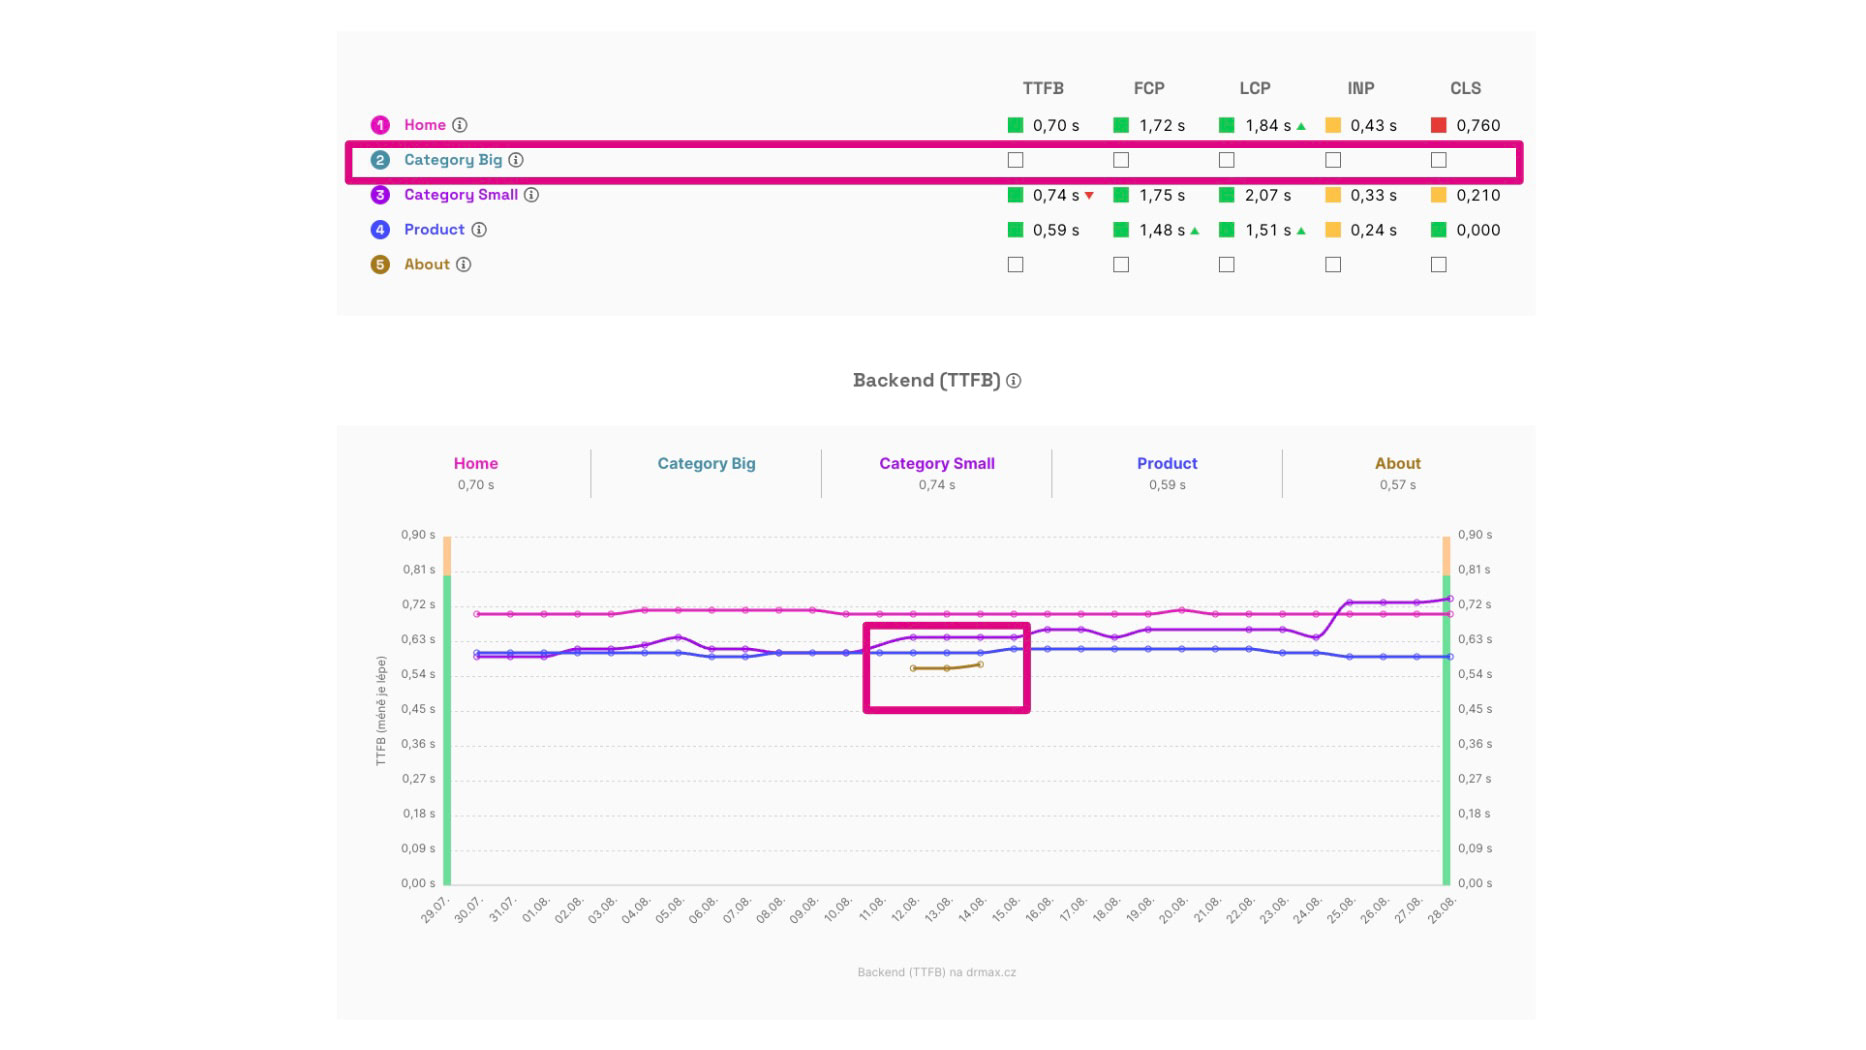 Above you can see that some pages may have no CrUX data at all. Below you can see data available only for certain days.
To display data from the Chrome UX Report, pages must meet a minimum traffic threshold. It’s common for smaller sites to have CrUX data for only a few representative pages.
Our Monitoring Settings documentation offers tips on finding better pages that have CrUX data from users.
Note, though, that for many sites you simply won’t have this data. That’s why we still show synthetic data here.
Individual charts and their meaning
There are two main sections here — user measurements and synthetic measurements.
User measurements for Pages
Data come from the Chrome UX Report and are available only for pages with sufficient traffic. They provide a very accurate view of speed for all Chrome users, but are only available cumulatively for the last 28 days. Google does not provide data for every page.
Here you can see the status and trend of these user metrics:
- Backend (TTFB) – server-side time (backend, code, and infrastructure).
- First Contentful Paint (FCP) – the first rendering of any content on screen.
- Largest Contentful Paint (LCP) – the first largest content element.
- Interaction to Next Paint (INP) – responsiveness during interactions.
- Cumulative Layout Shift (CLS) – sum of undesirable layout shifts.
Synthetic measurements for Pages
Shows the status and trends of the URLs tested with synthetic measurements. Data come from Lighthouse tests (see how we test). They’re available for a specific measurement day and per URL, but may be less precise since they are not user-based.
Here you can see the status and trends of these synthetic metrics:
- Lighthouse Score (LPS) – overall speed score.
- Backend (TTFB) – server-side time.
- First Contentful Paint (FCP) – first content render.
- Largest Contentful Paint (LCP) – first largest element.
- Total Blocking Time (TBT) – time the browser is blocked by frontend code.
- Total Blocking Time by third parties (3PBT) – third-party blocking time.
- Cumulative Layout Shift (CLS) – sum of unexpected layout shifts.
Notes on metrics and differences
While looking at the metrics above, you might have a few questions. Here are the most common answers:
-
Why do different measurement types include different metrics? User-based (CrUX) metrics and synthetic metrics differ because some metrics can only be derived from real users (like INP), while others are synthetic (LPS, TBT).
-
Why do different measurement types return different values for the same metric? User-derived values may vary. For example, CLS is computed synthetically at first paint but observed across the entire session by real users.
-
Which metric should I focus on? Primarily focus on user-facing CrUX metrics within the Core Web Vitals (LCP, CLS, INP).
Summary
Key takeaways about the Pages report:
- The report provides detailed tracking of metric trends for the measured URLs.
- Always choose the right URLs in Settings.
- The Pages report is geared toward developers and other technically inclined users who want to dig into speed.
- Even if metrics share the same name, values may differ between sources.
- Focus primarily on CrUX Core Web Vitals data.
Want to understand the measurements as a whole? Down below you’ll find the complete speed-tuning tutorial using the PageSpeed.cz tester.