Welcome to the PageSpeed.cz Web Speed Tester!
Before you start using our tool, take a quick tour of the features it offers.
The PageSpeed.cz Speed Tester helps you measure your site’s current speed, monitor changes, evaluate the impact of optimizations, and provides concrete optimization recommendations.
The essentials
If you don’t want to dive into every metric, remember these two key data views — the Team Dashboard and the Test Summary.
Team Dashboard
This is the main place to monitor the speed of your domains. Here you’ll see speed data from Google users (Chrome UX Report).
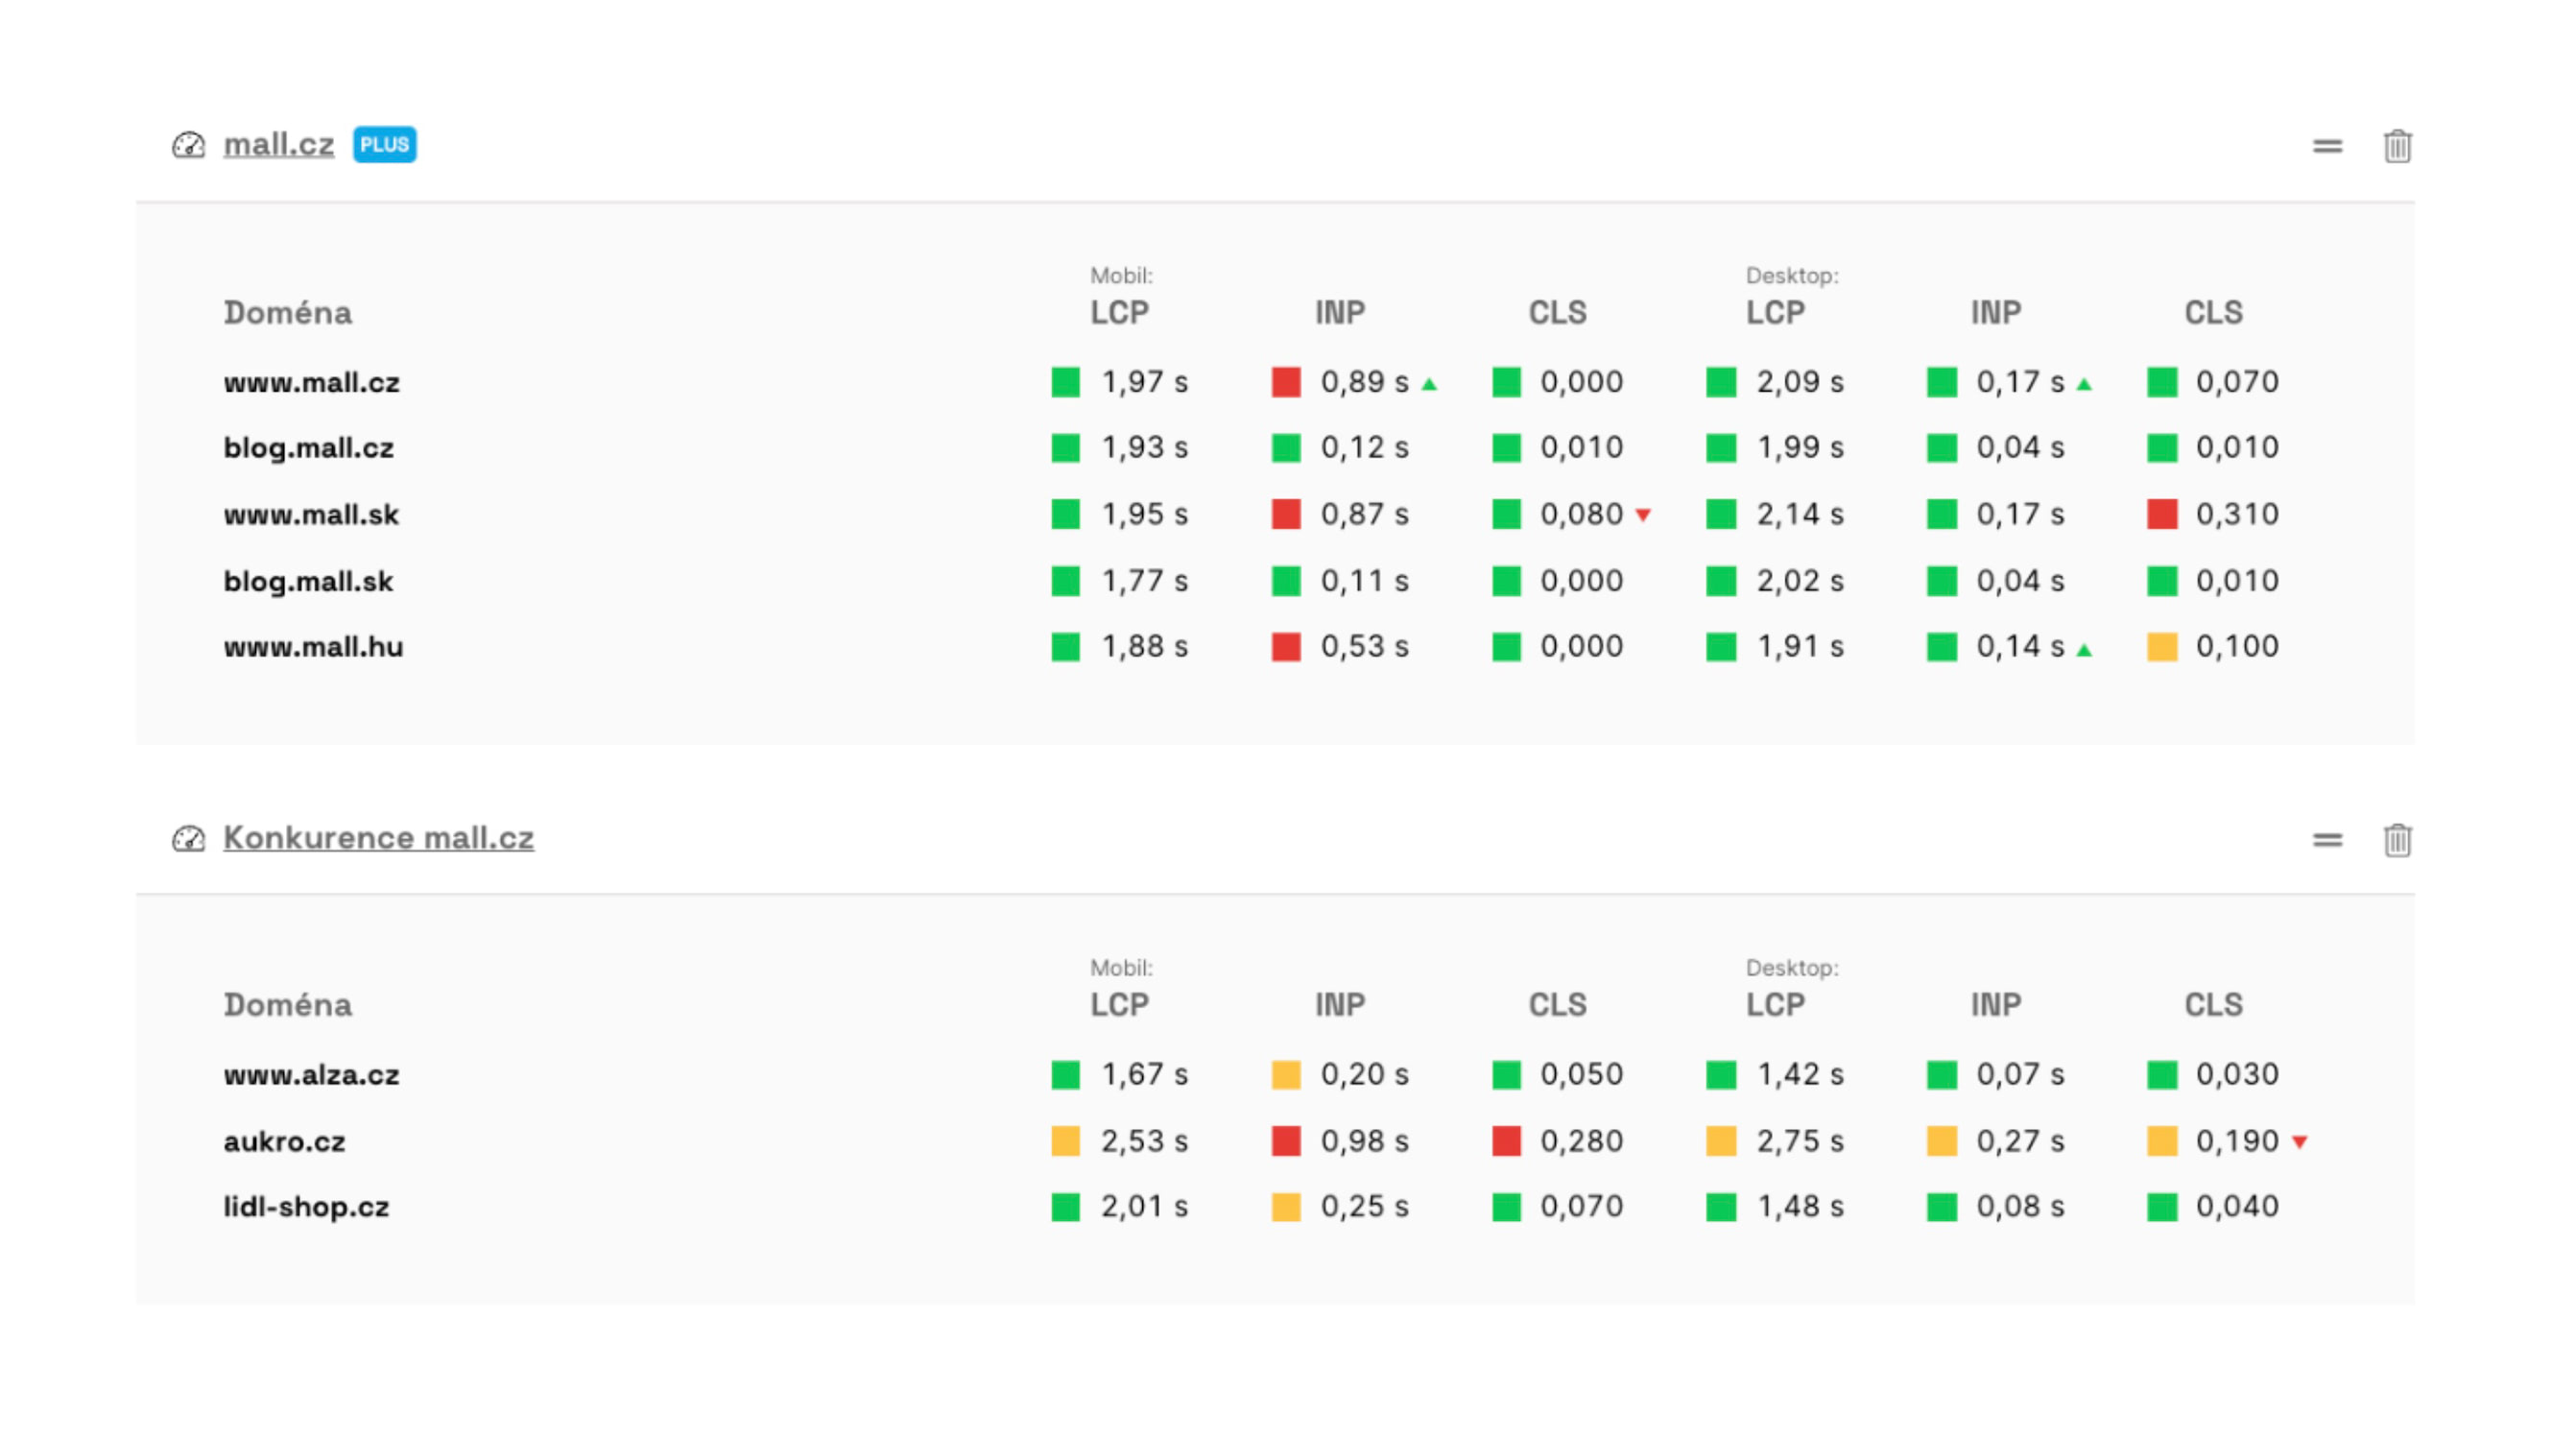 The team dashboard can include multiple tests.
🔒 This dashboard is available only to team members or PLUS Tests users.
The Test
In a test, you’ll see a summary of different measurement types. The most important data, of course, comes from Google user data for the domains:
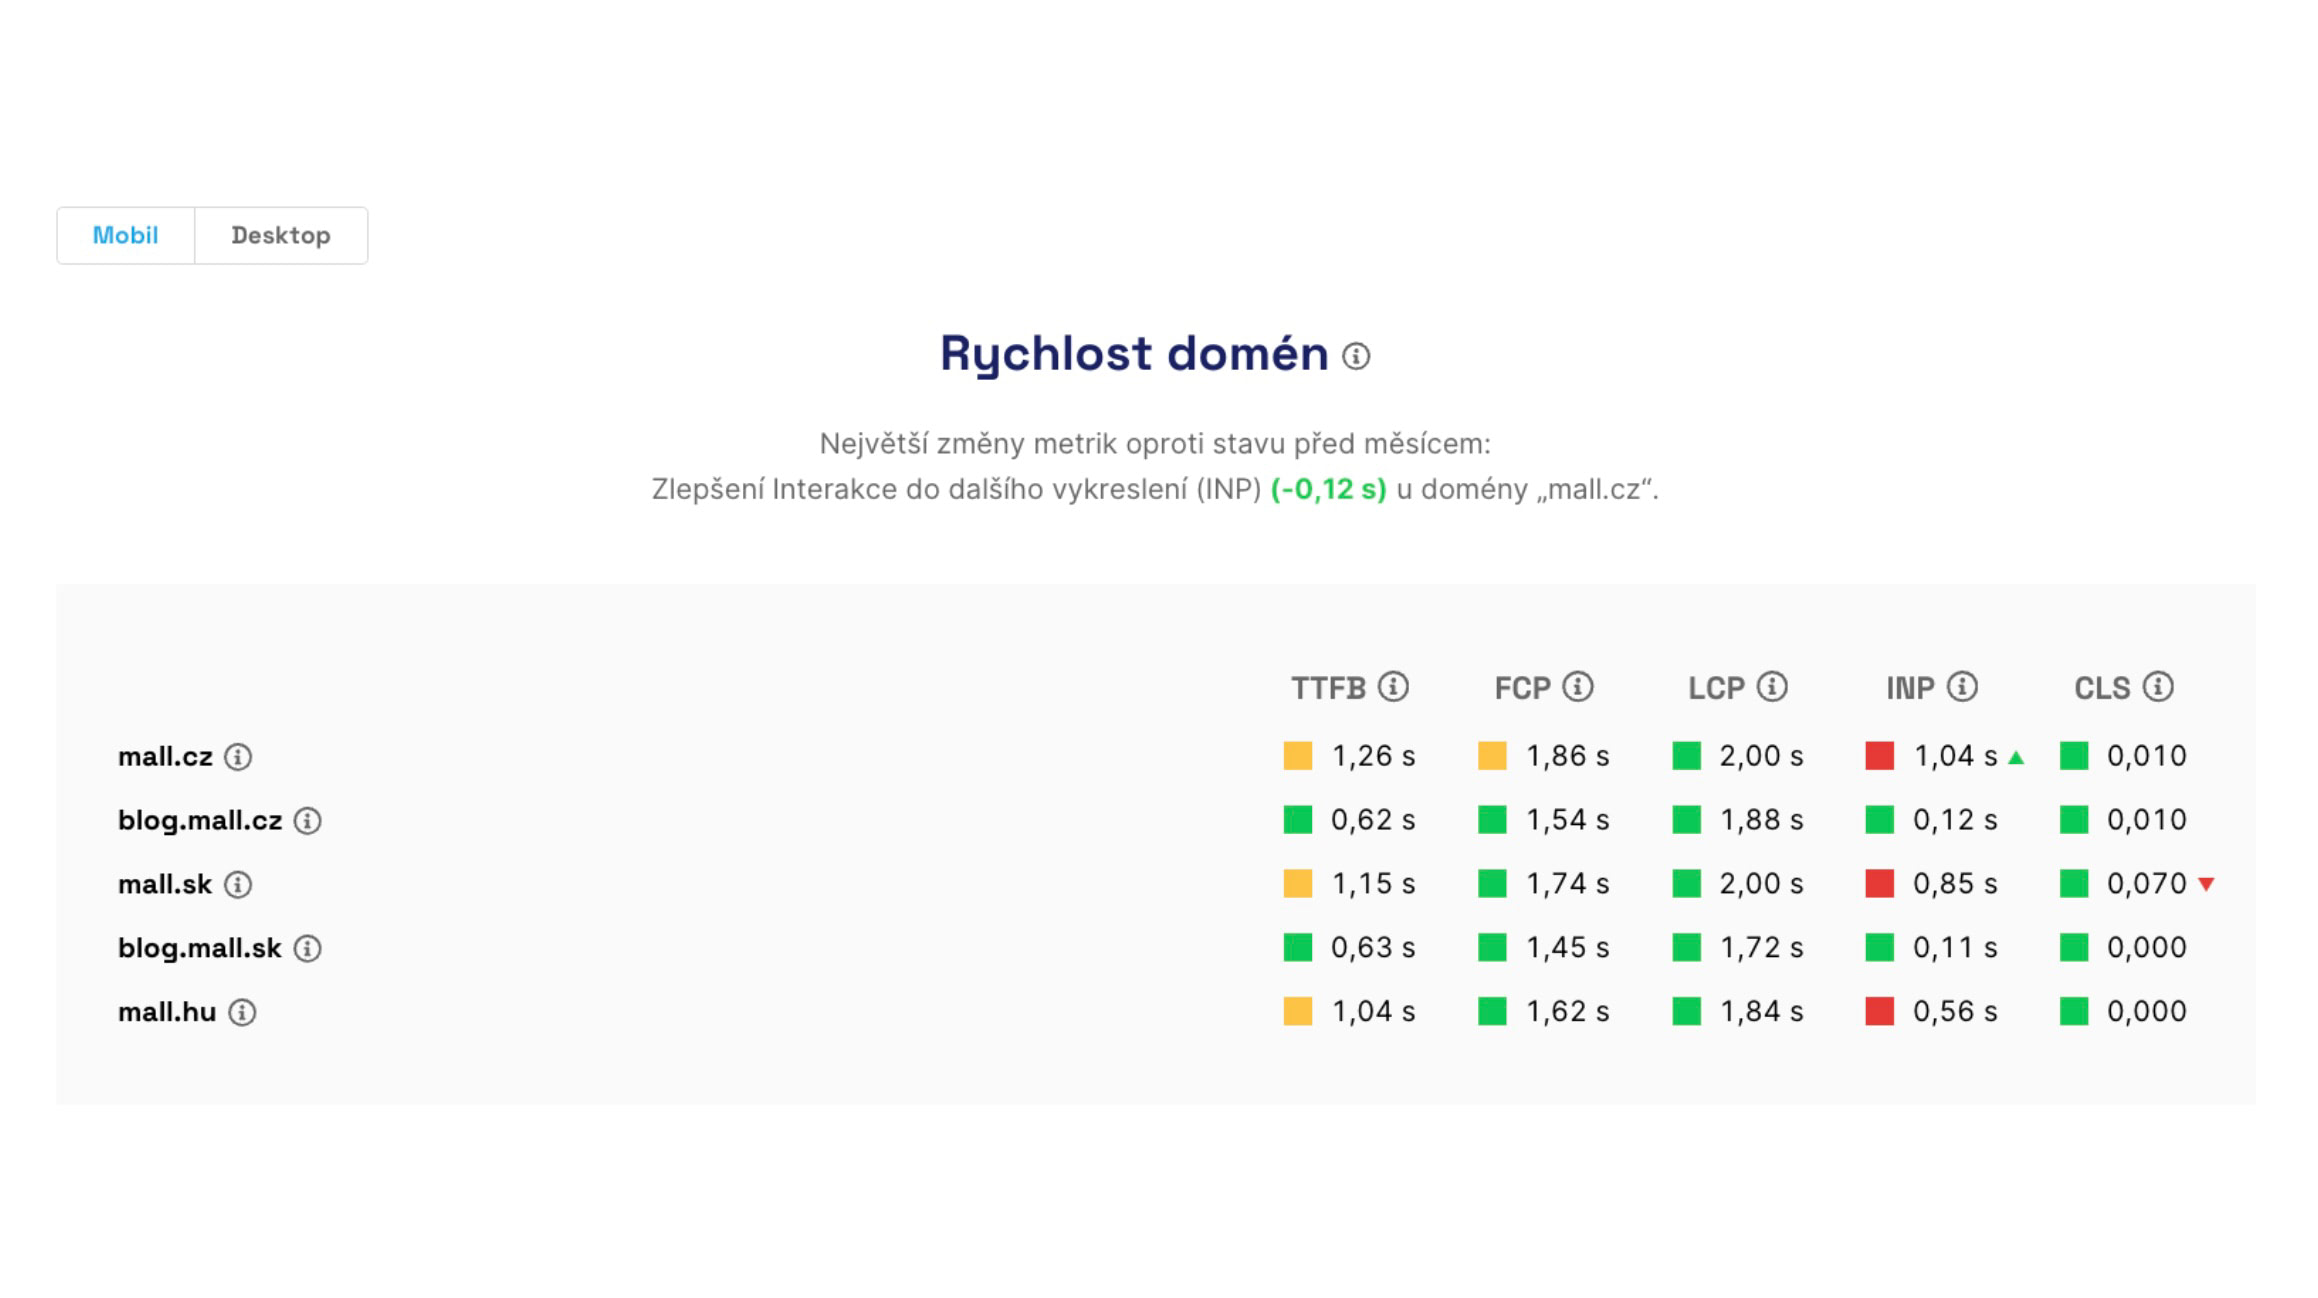 The Summary report also shows useful metrics such as TTFB (server response) or FCP (first contentful paint).
In the Summary report you’ll see the status of metrics for various measurements (Chrome UX Report or synthetic), their changes over the past month, for mobile and desktop. More on the Summary report.
In the test itself you’ll see many different views of speed for the measured URLs and domains.
For team admins
If you manage a team, you’ll be interested in user administration and test settings.
Team management
Here you can add more colleagues who should view speed data or receive change notifications.
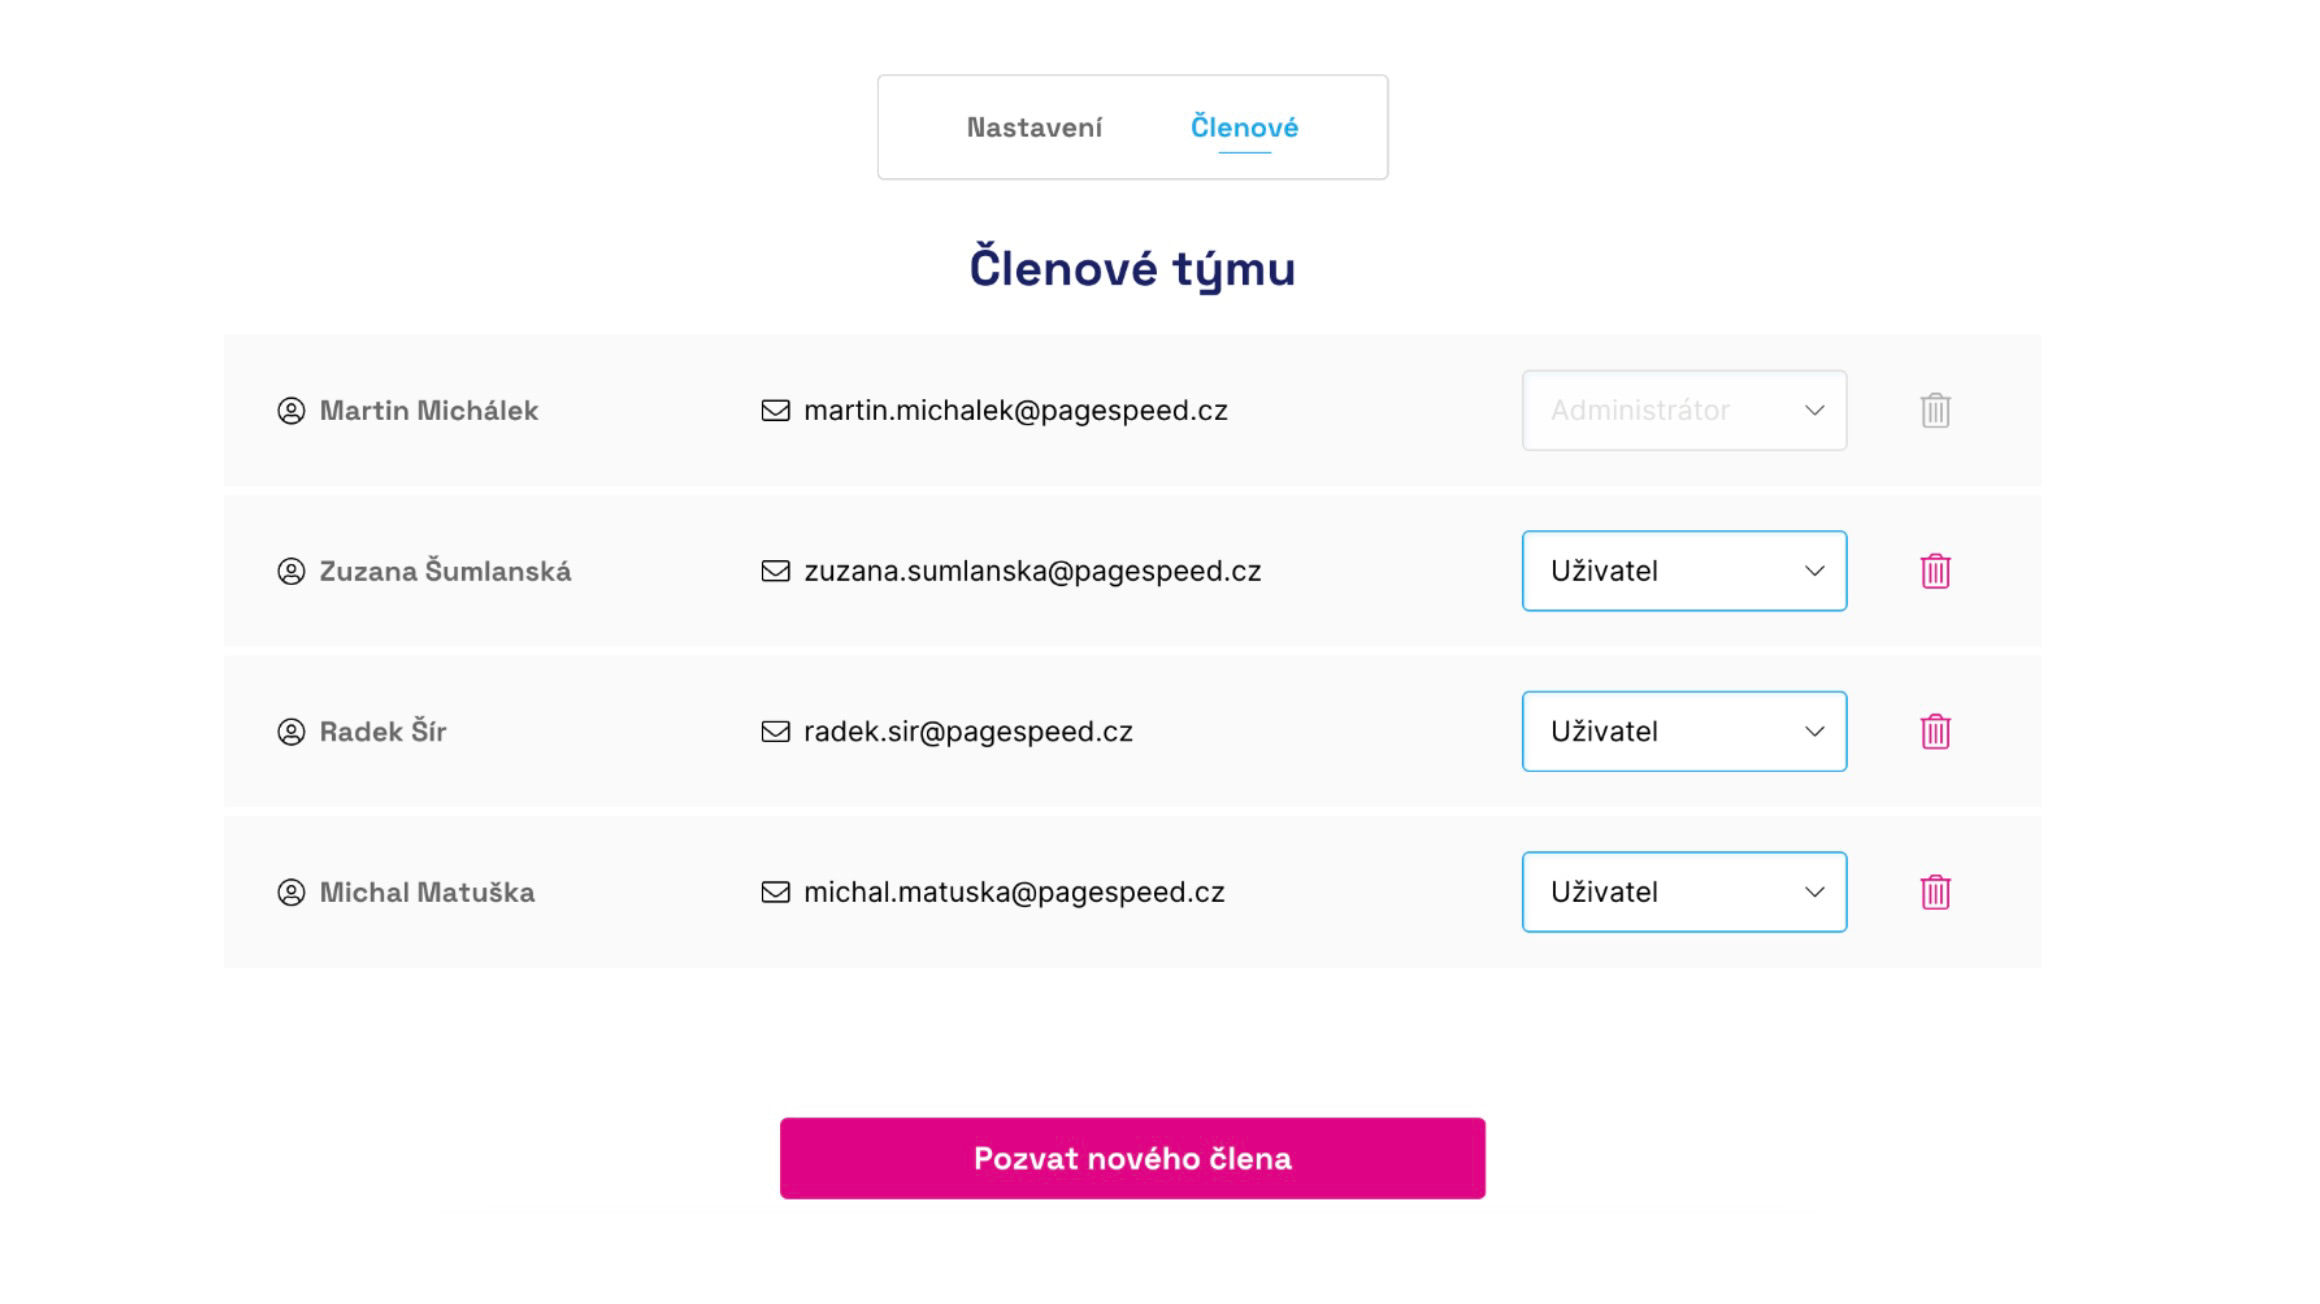 Team members can be granted different permissions.
We recommend adding everyone whose work is influenced by speed — developers, marketers, and managers.
🔒 Team management is available only in PLUS tests.
Test settings
In Settings you can change the measured URLs (we recommend configuring the most common entry pages) and also the domains (e.g., a client’s subdomains or competitors):
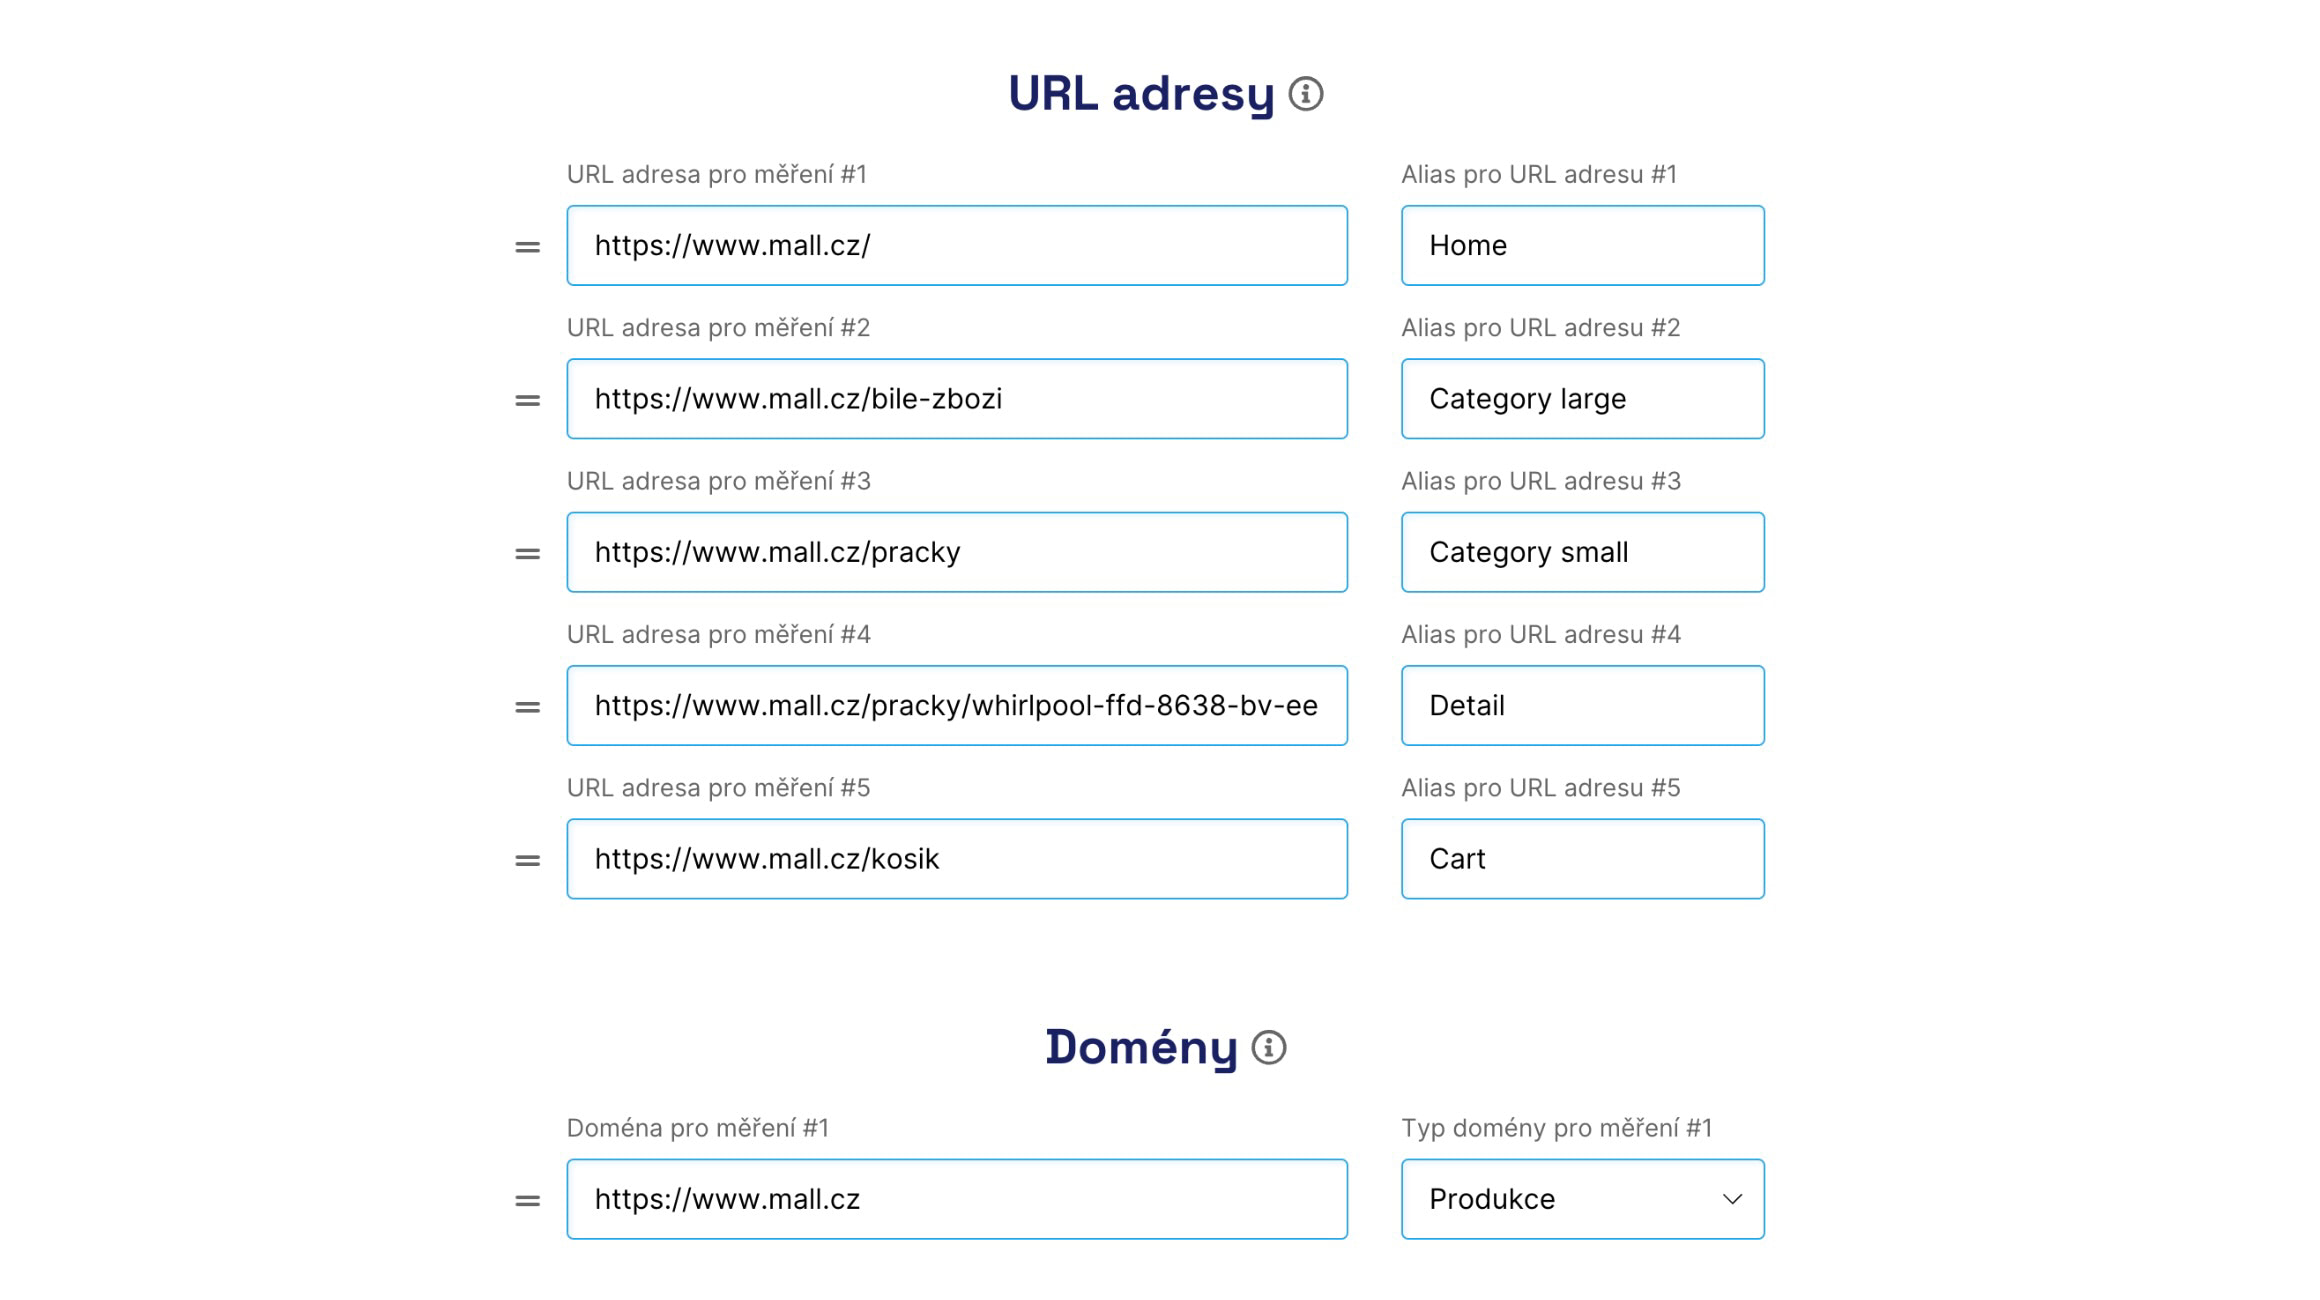 In settings, adjust the monitored entry pages and domains (yours or competitors).
🔒 In PLUS tests you can monitor 5 URLs and 5 domains, with more available for an extra fee. The free version supports 3 URLs and 3 domains.
Speed Monitoring and Change Evaluation
Watchdog
About a week after you start testing, Watchdog monitoring levels are configured and ongoing tracking of the current speed begins.
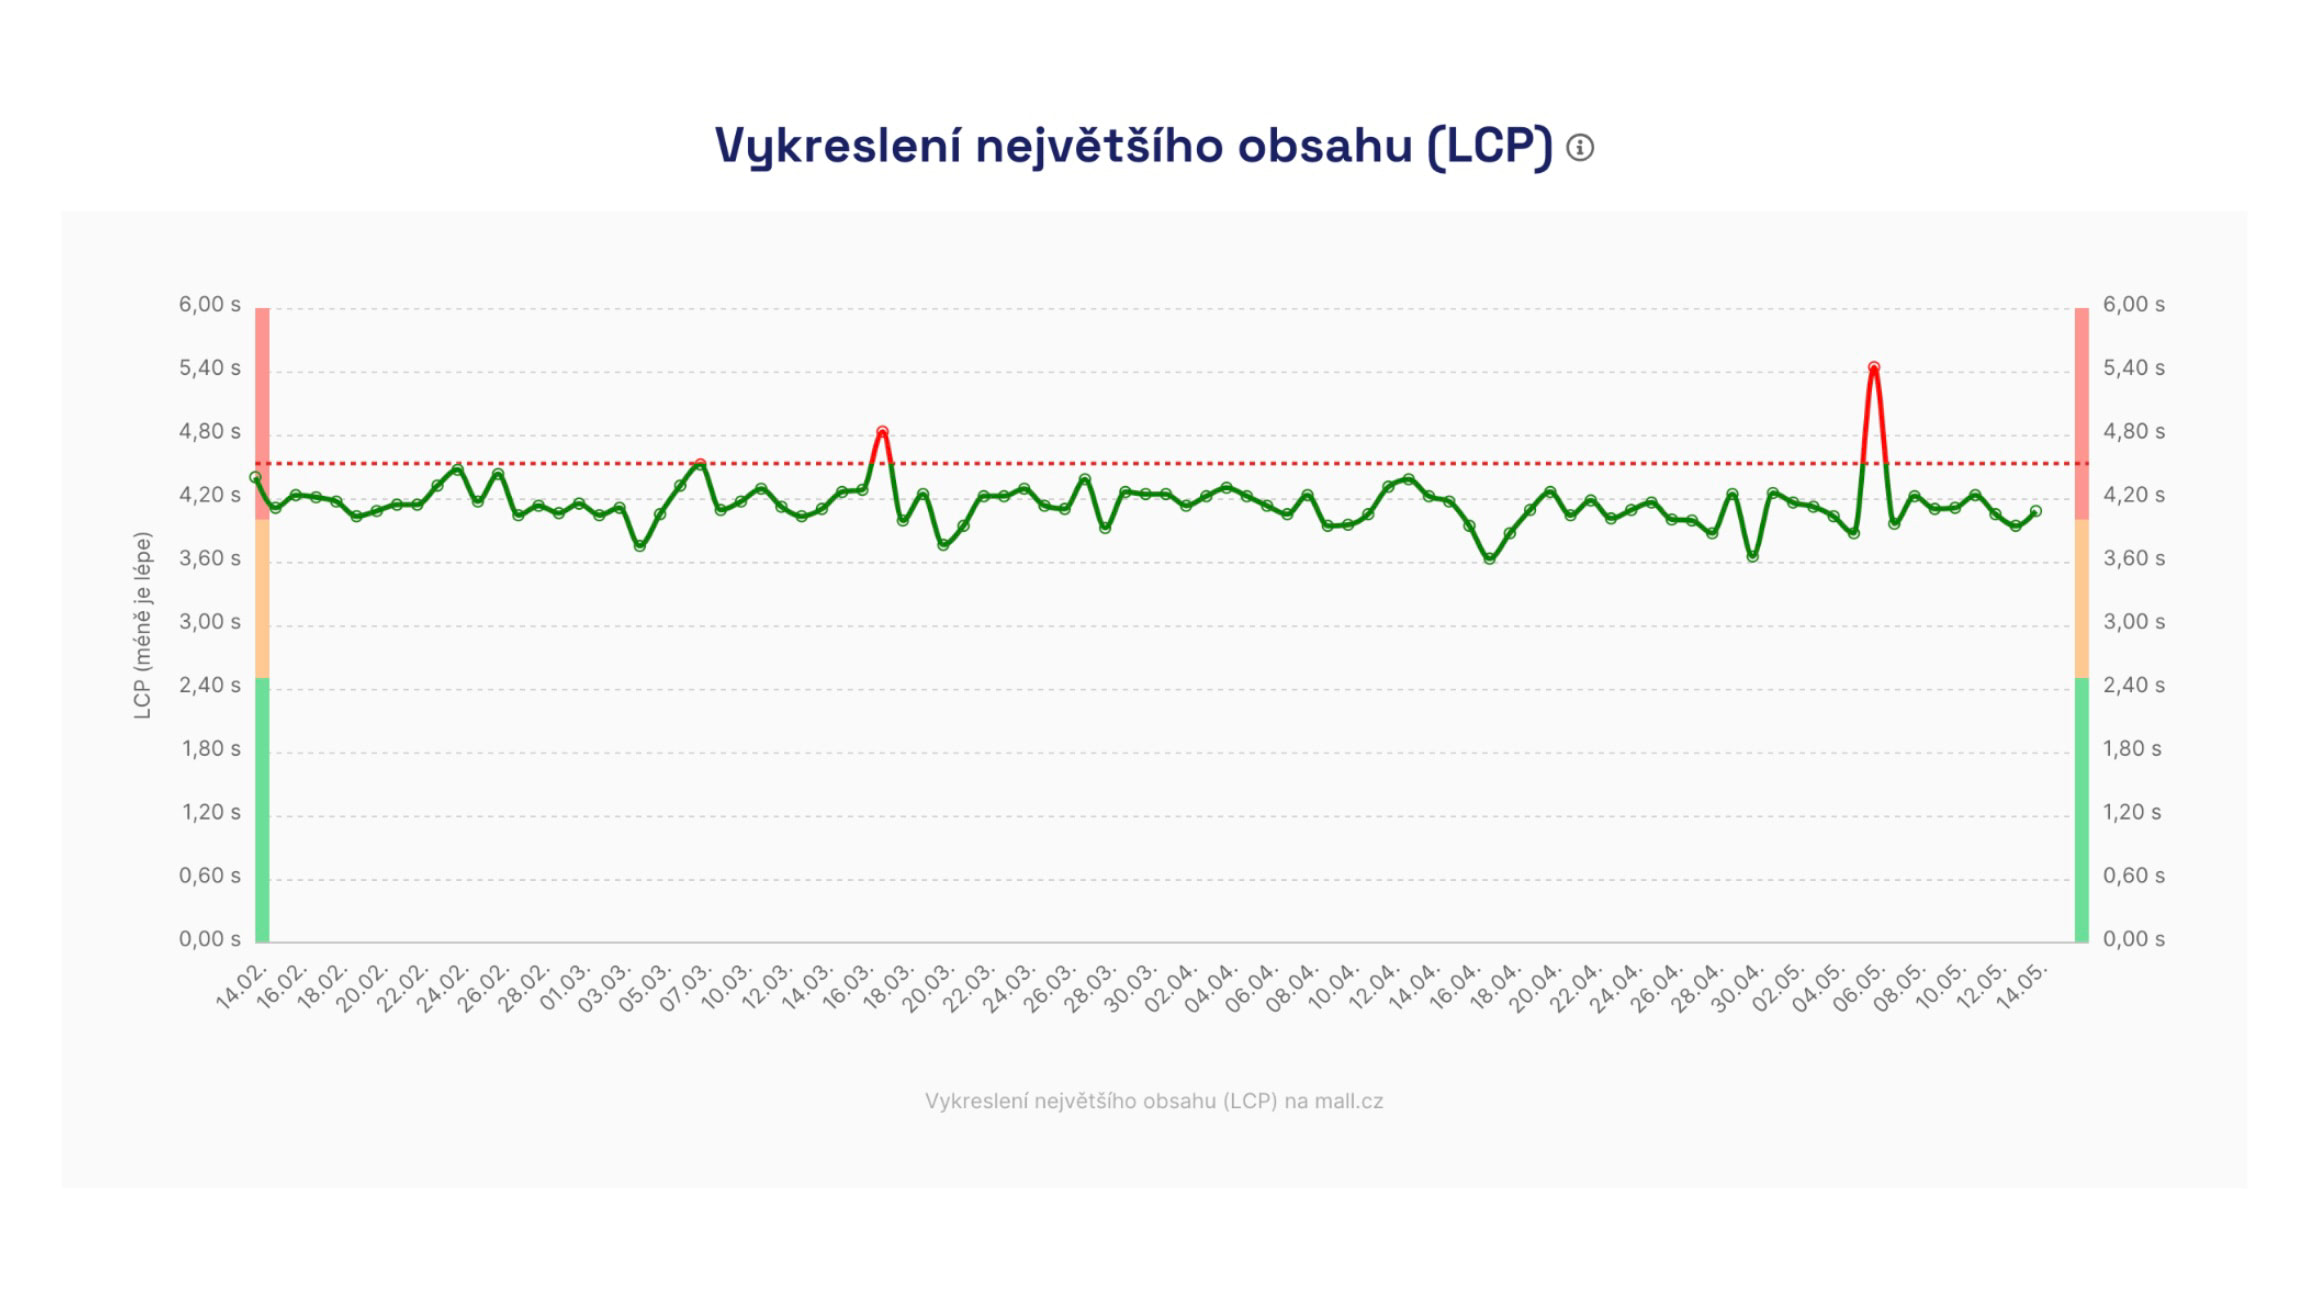 Watchdog shows daily trends of metrics such as LCP (loading speed).
If an important metric worsens or improves, you’ll receive a notification.
🔒 Watchdog is part of PLUS tests. Learn more about Watchdog.
Watchdog notifications arrive by email. You can also have them sent to Slack or Teams — see Settings.
To verify Watchdog notifications, review metric trends in the Domains report.
Page Report and details of a specific test run
If Watchdog flags an issue, use the Pages report to identify which specific page type is causing trouble on your site:
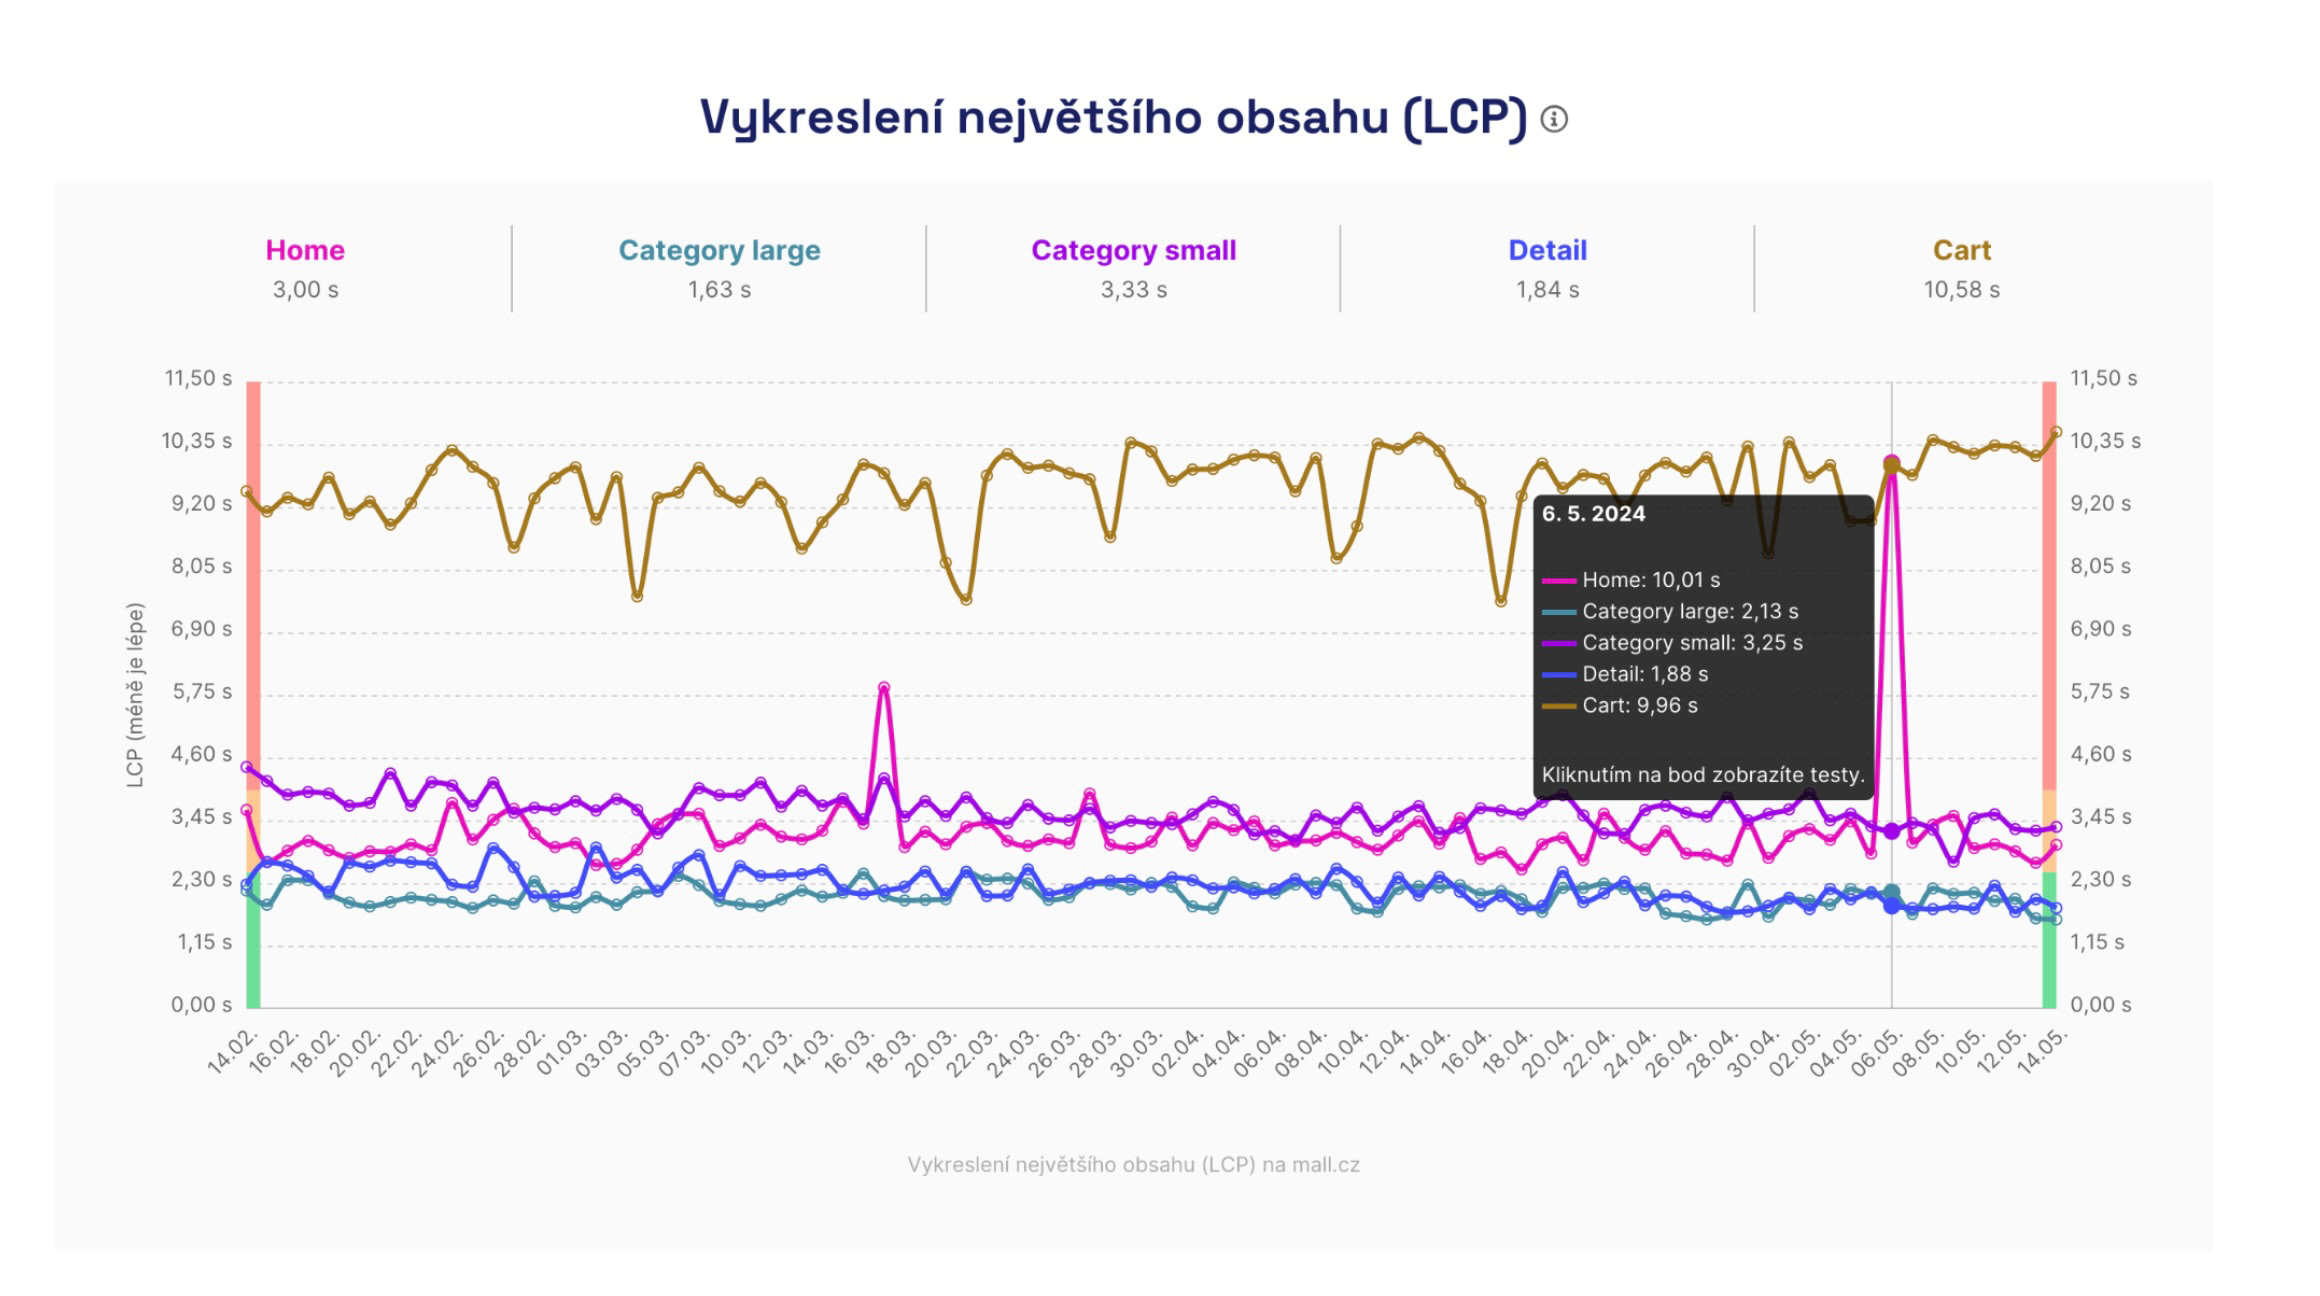 LCP breakdown by pages in the Pages report.
Click a point in the synthetic measurements chart to access the test run results:
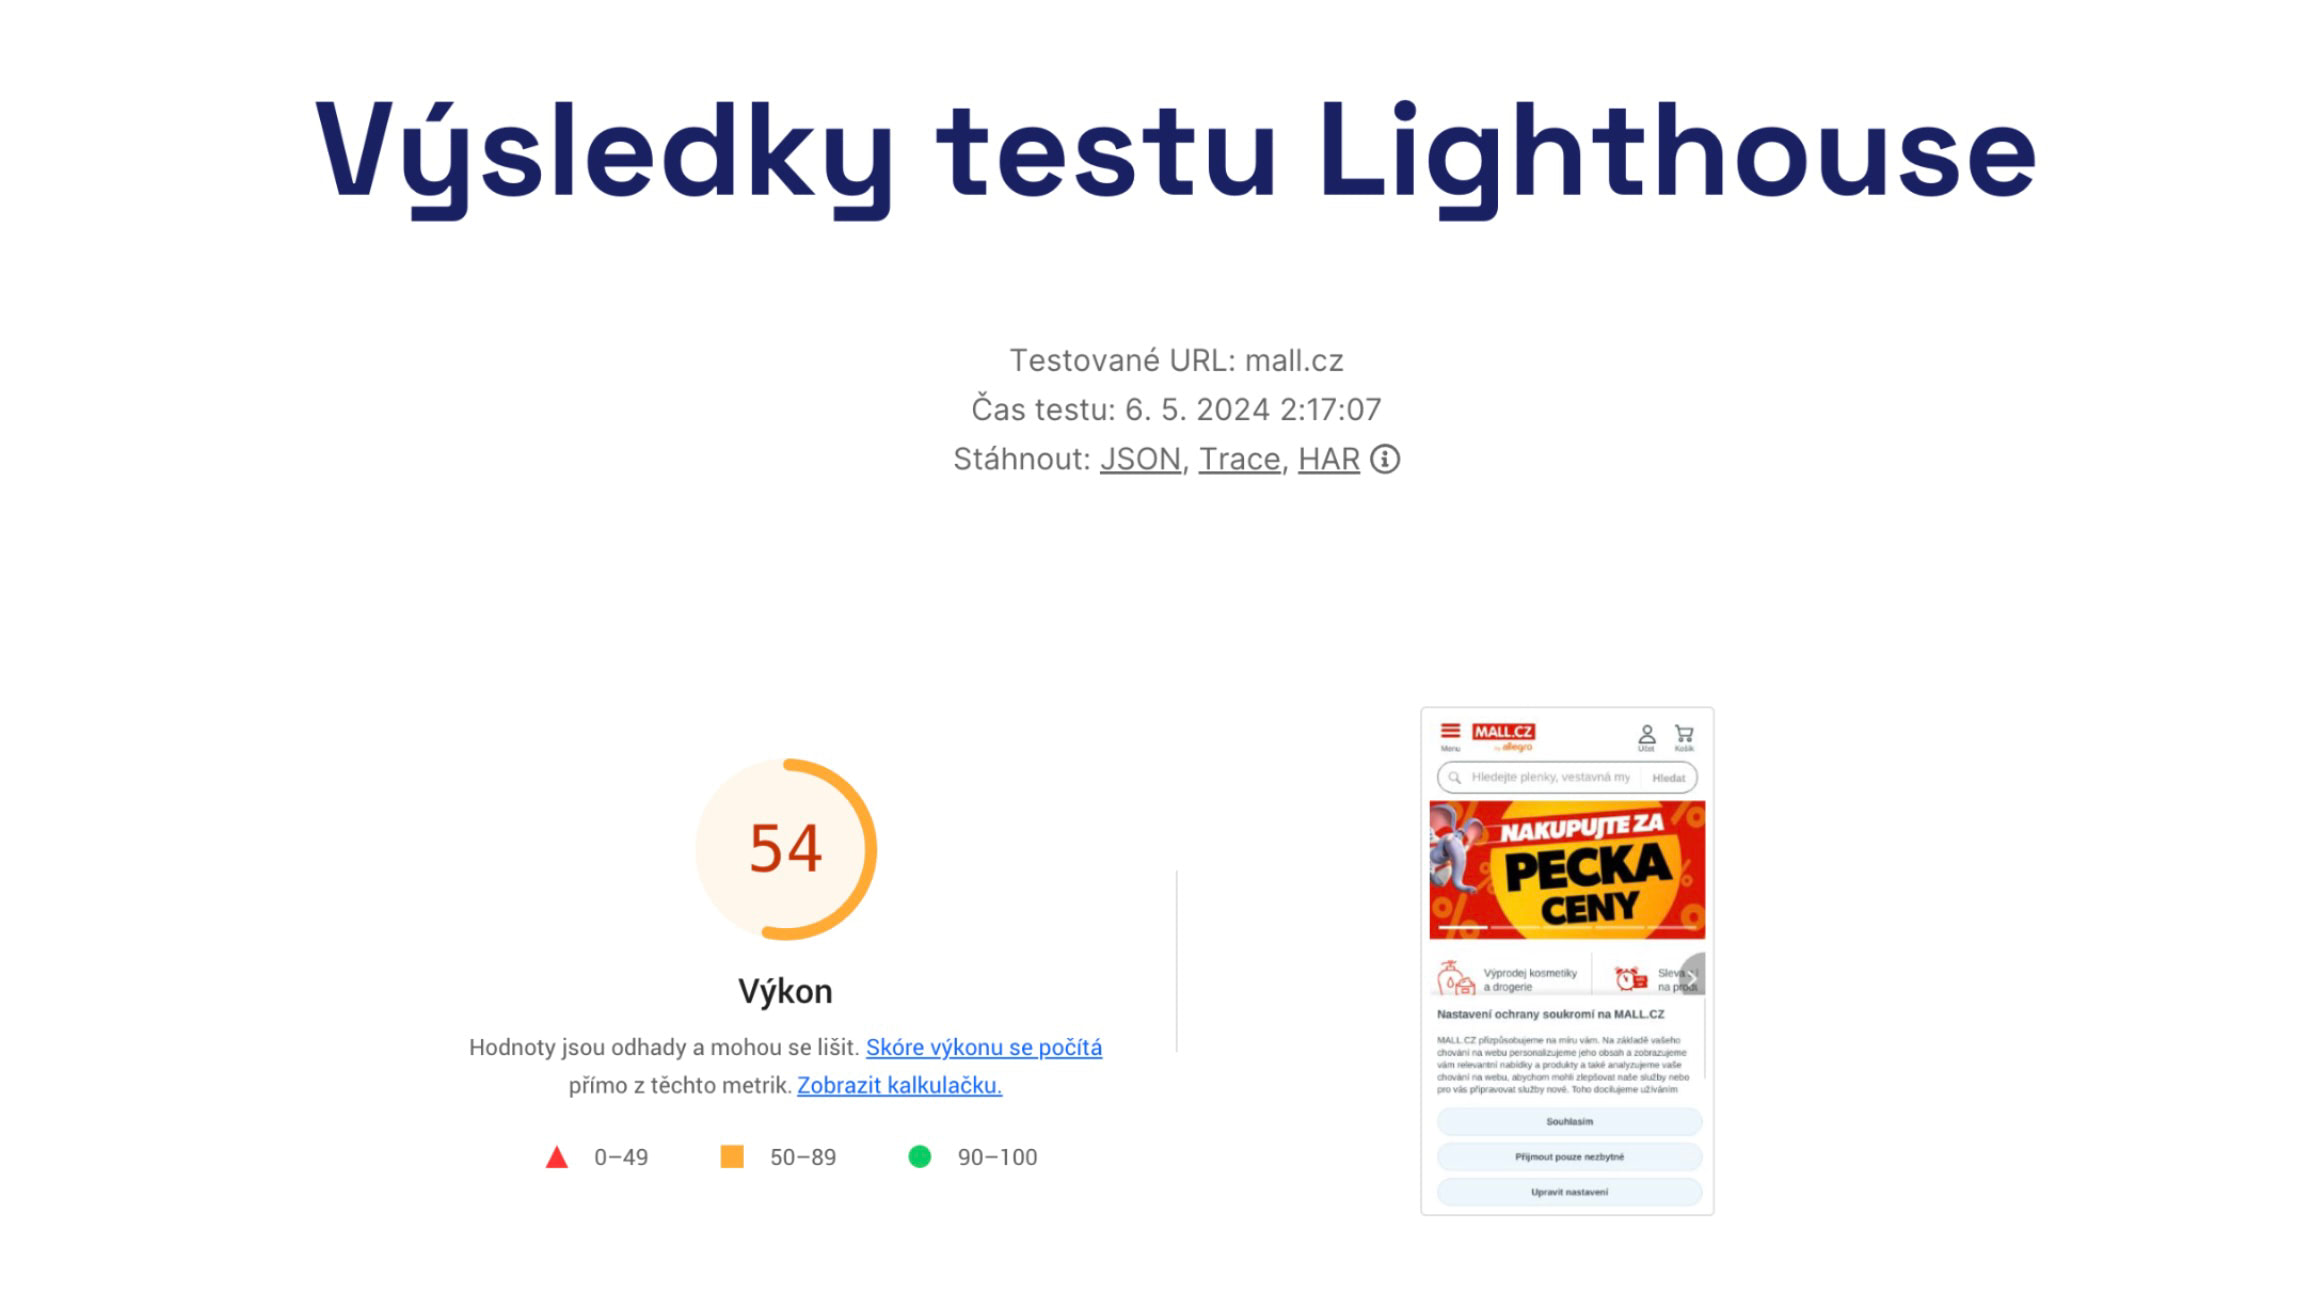 Lighthouse results are available, including files for further debugging, such as traces.
There’s a [tutorial] on how to use the speed tester to pinpoint and fix specific issues: https://www.vzhurudolu.cz/blog/237-pagespeed-cz-plus-tutorial
Technical Report
In the Technical report we display data movements that aren’t primary metrics but can help evaluate changes for improvement or regression.
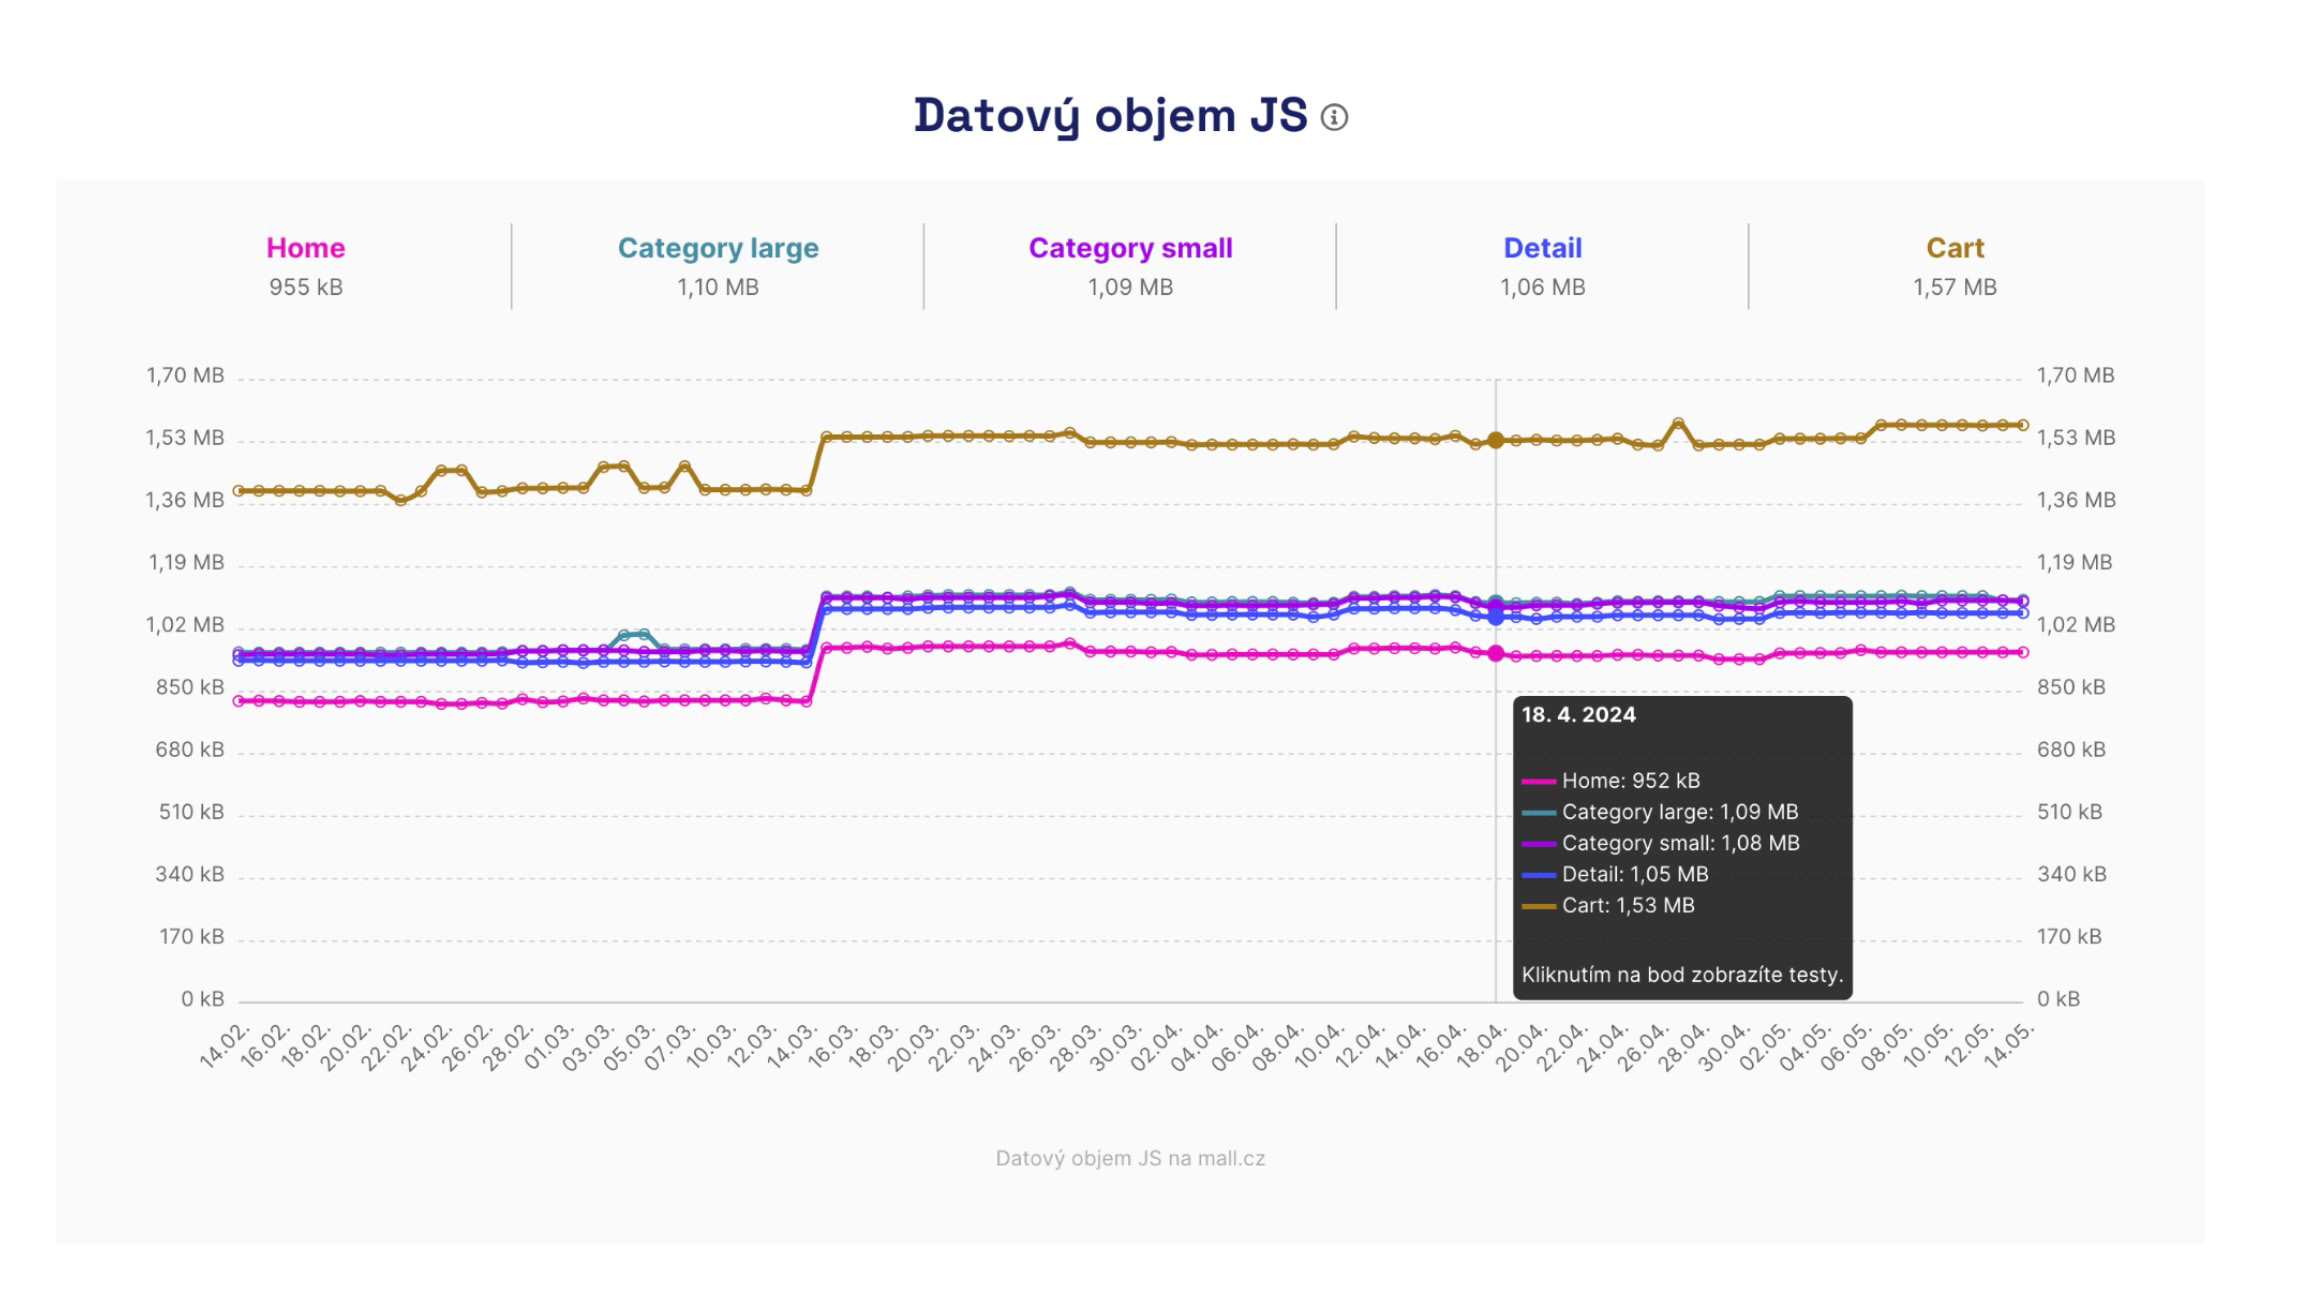 The JS data volume shown here has grown, which may warrant attention.
These are technical data such as HTML size, JavaScript payload, and so on.
🔒 The Technical Report is part of PLUS tests.
Opportunities Report
In the tester interface we also offer potential speed improvements for individual page types:
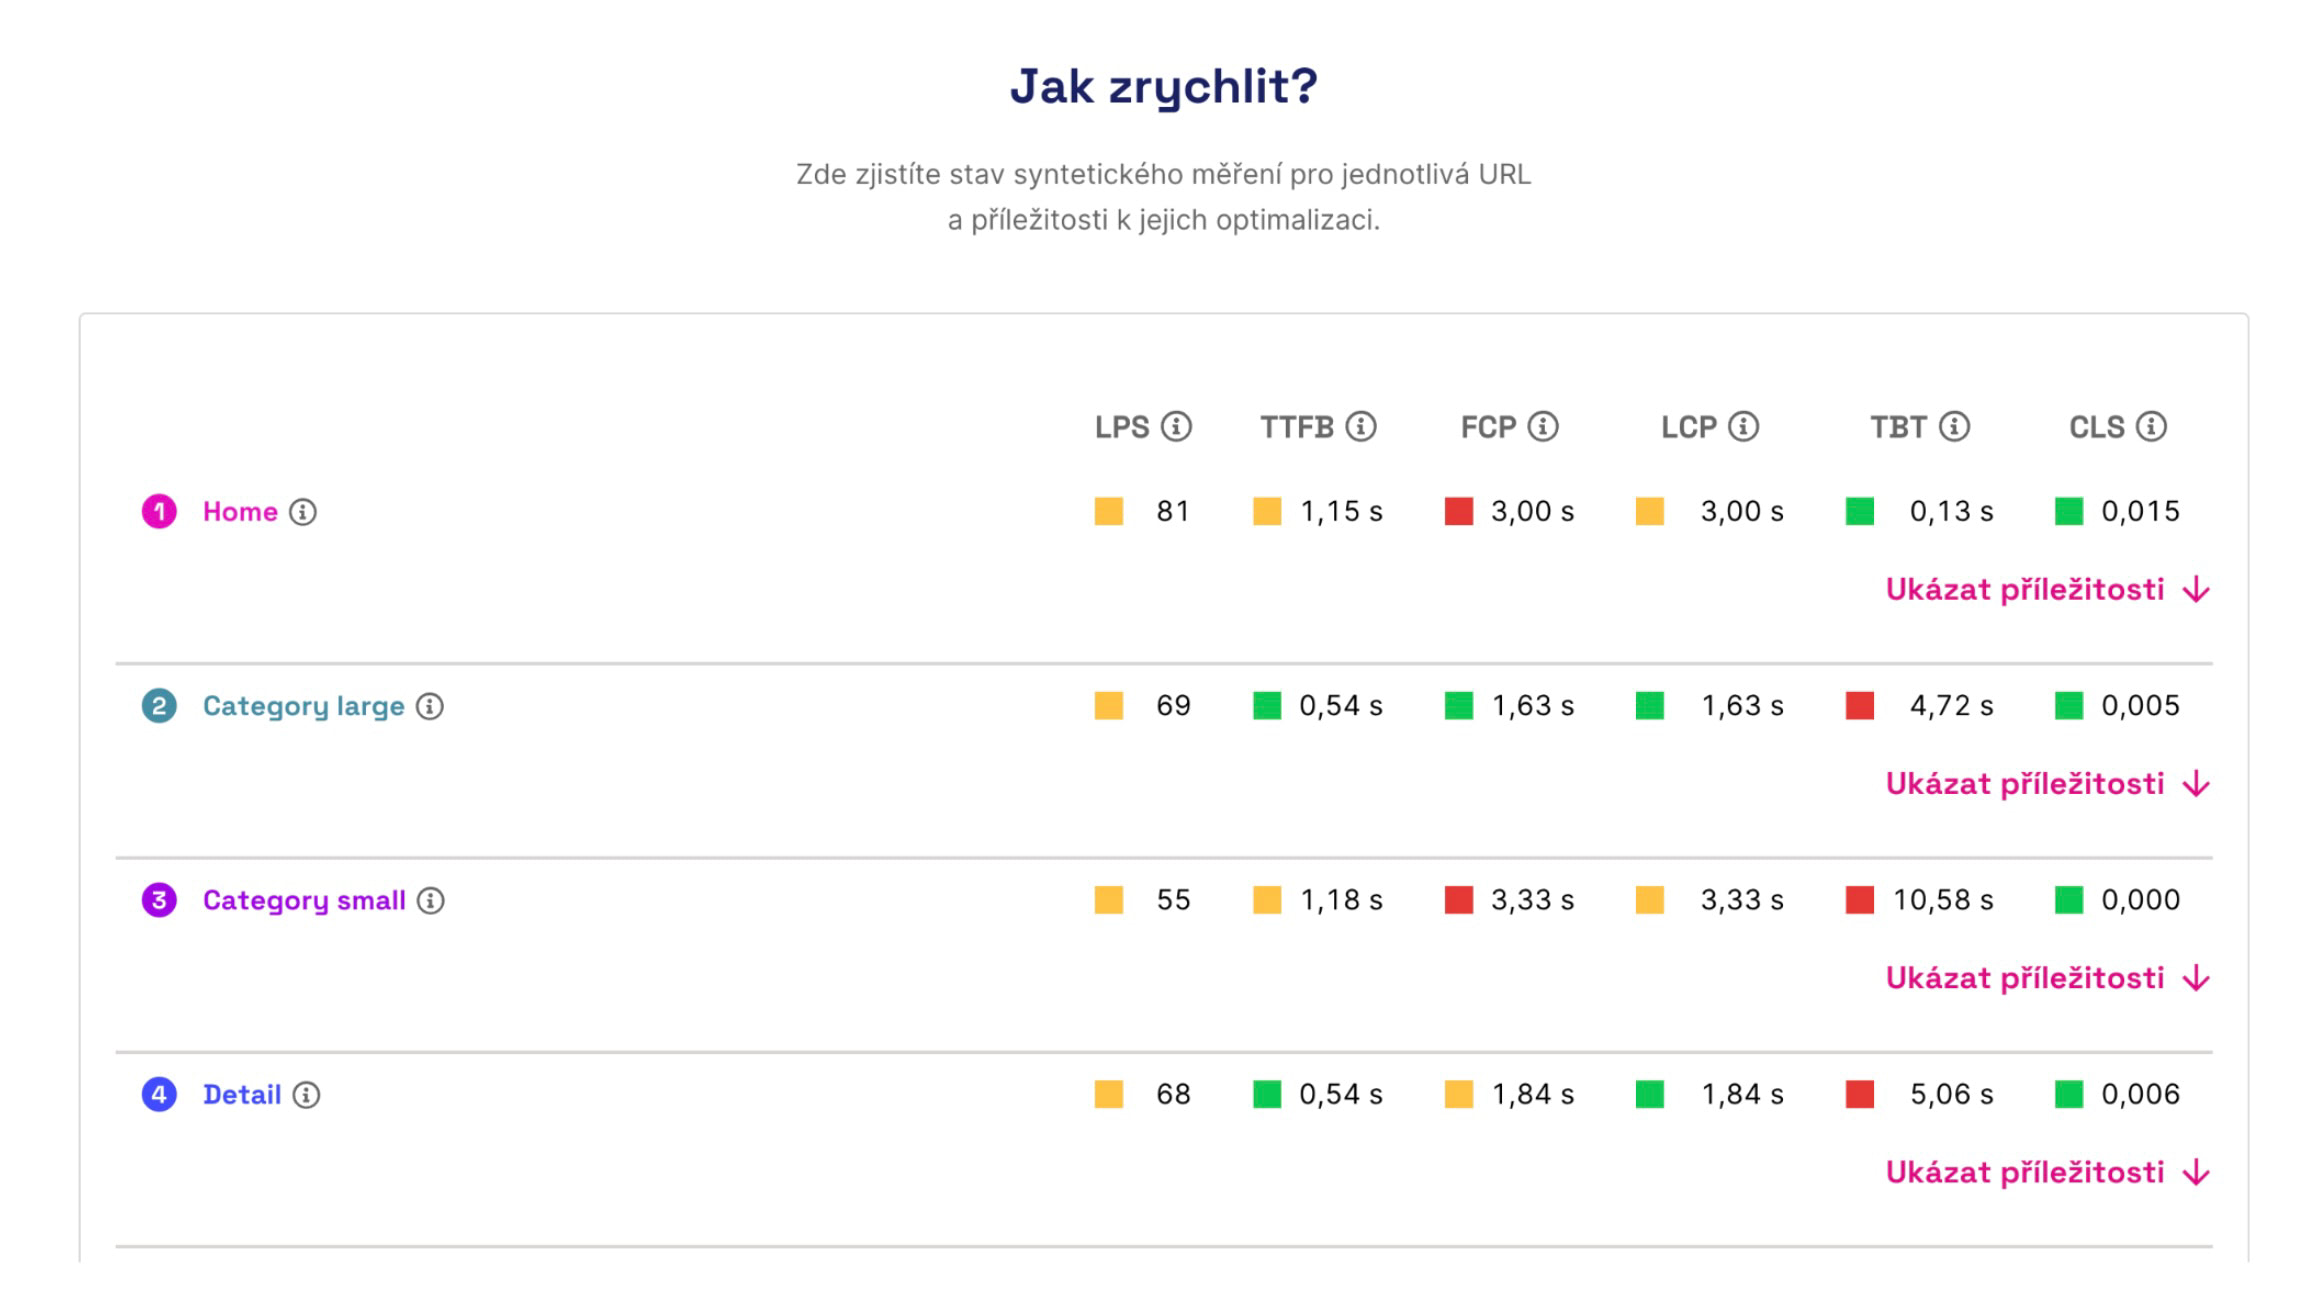
Review the opportunities to improve for each measured URL.
🔒 The Opportunities Report is part of PLUS tests; the free version shows opportunities only for the first measured URL.
Currently these are Lighthouse opportunities; we plan to gradually add our own. The same can be found in the details of a specific test run by clicking a point in the synthetic measurement chart.
Notes
Notes in charts help you more easily assess the impact of changes you’ve made. In some cases we also add notes automatically.
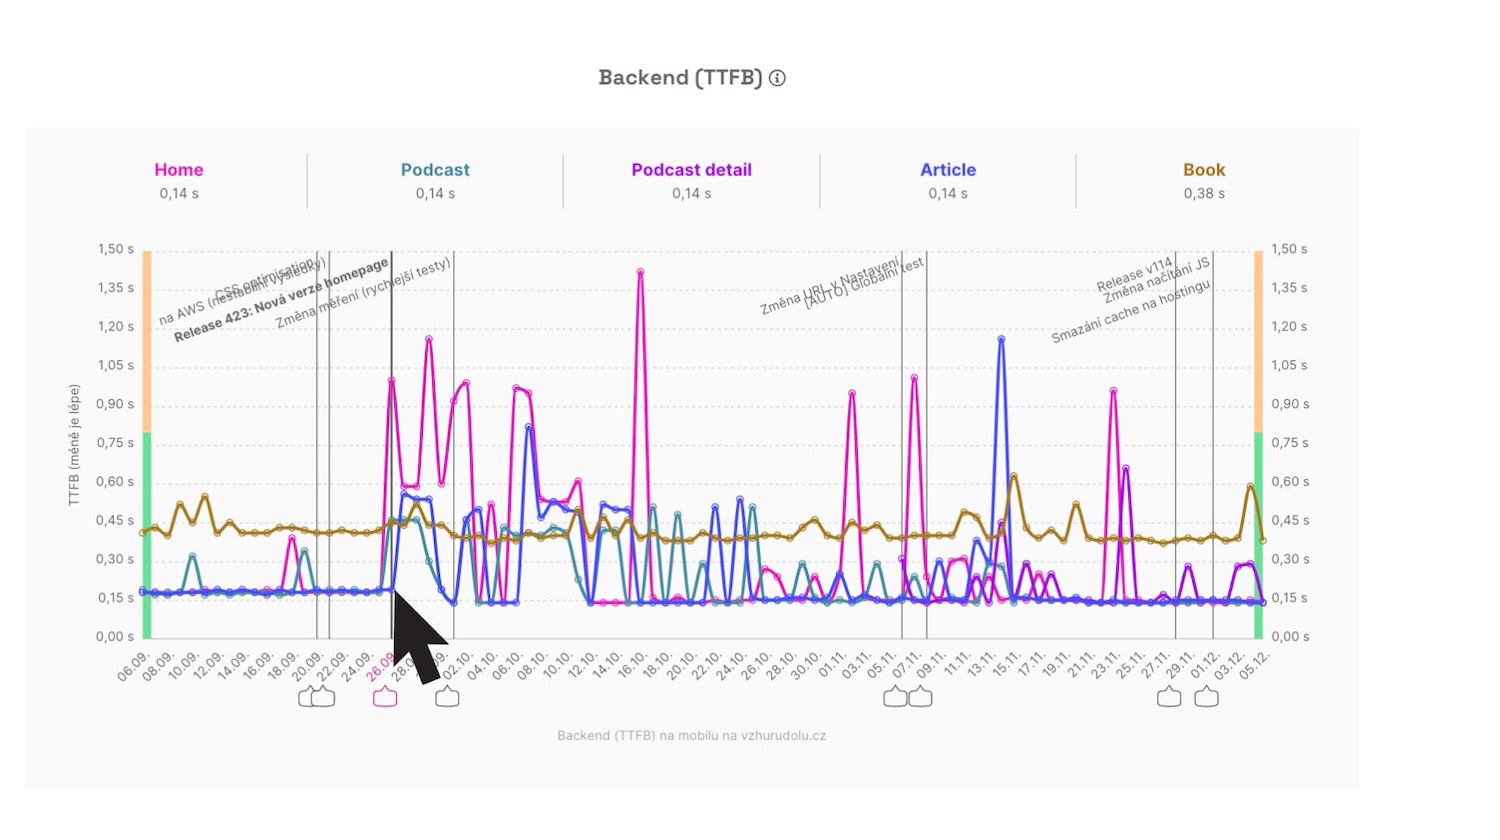 Notes appear in all charts so you won’t miss any potential impact on any speed metric.
Need help? Have feedback?
If you have feedback or questions, email us at info@pagespeed.cz.
We also offer optimization services; we’d be happy to help improve your site speed.