Interaction to Next Paint (INP) Metric: Tackling Slow Interactions
Attention, developers and web owners. If you haven’t heard yet, Google is introducing a new metric: Interaction to Next Paint (INP). In March 2024, as part of the Core Web Vitals' top three metrics, it will replace First Input Delay (FID).
INP is stricter and better reflects the user experience. It’s an interactivity metric, i.e., the speed of response to user actions after the page has loaded and the user interacts with components such as carousels, accordions, or when adding items to the cart.
Optimizing this metric can take months, so now is the best time to start.
What is the INP metric?
INP answers the question: How fast does it respond?
Interaction to Next Paint measures overall page latency to user interactions by tracking the delays of all events that occur during a visit.
Scroll and hover are not counted; instead, the response to clicks or keyboard input is considered.
With a large number of interactions, the calculation changes: every 50 interactions on a page, the highest value is ignored. Google aims to make the metric more precise and reduce the impact of random hiccups on heavily interacted web apps, such as gaming interfaces.
How INP is measured
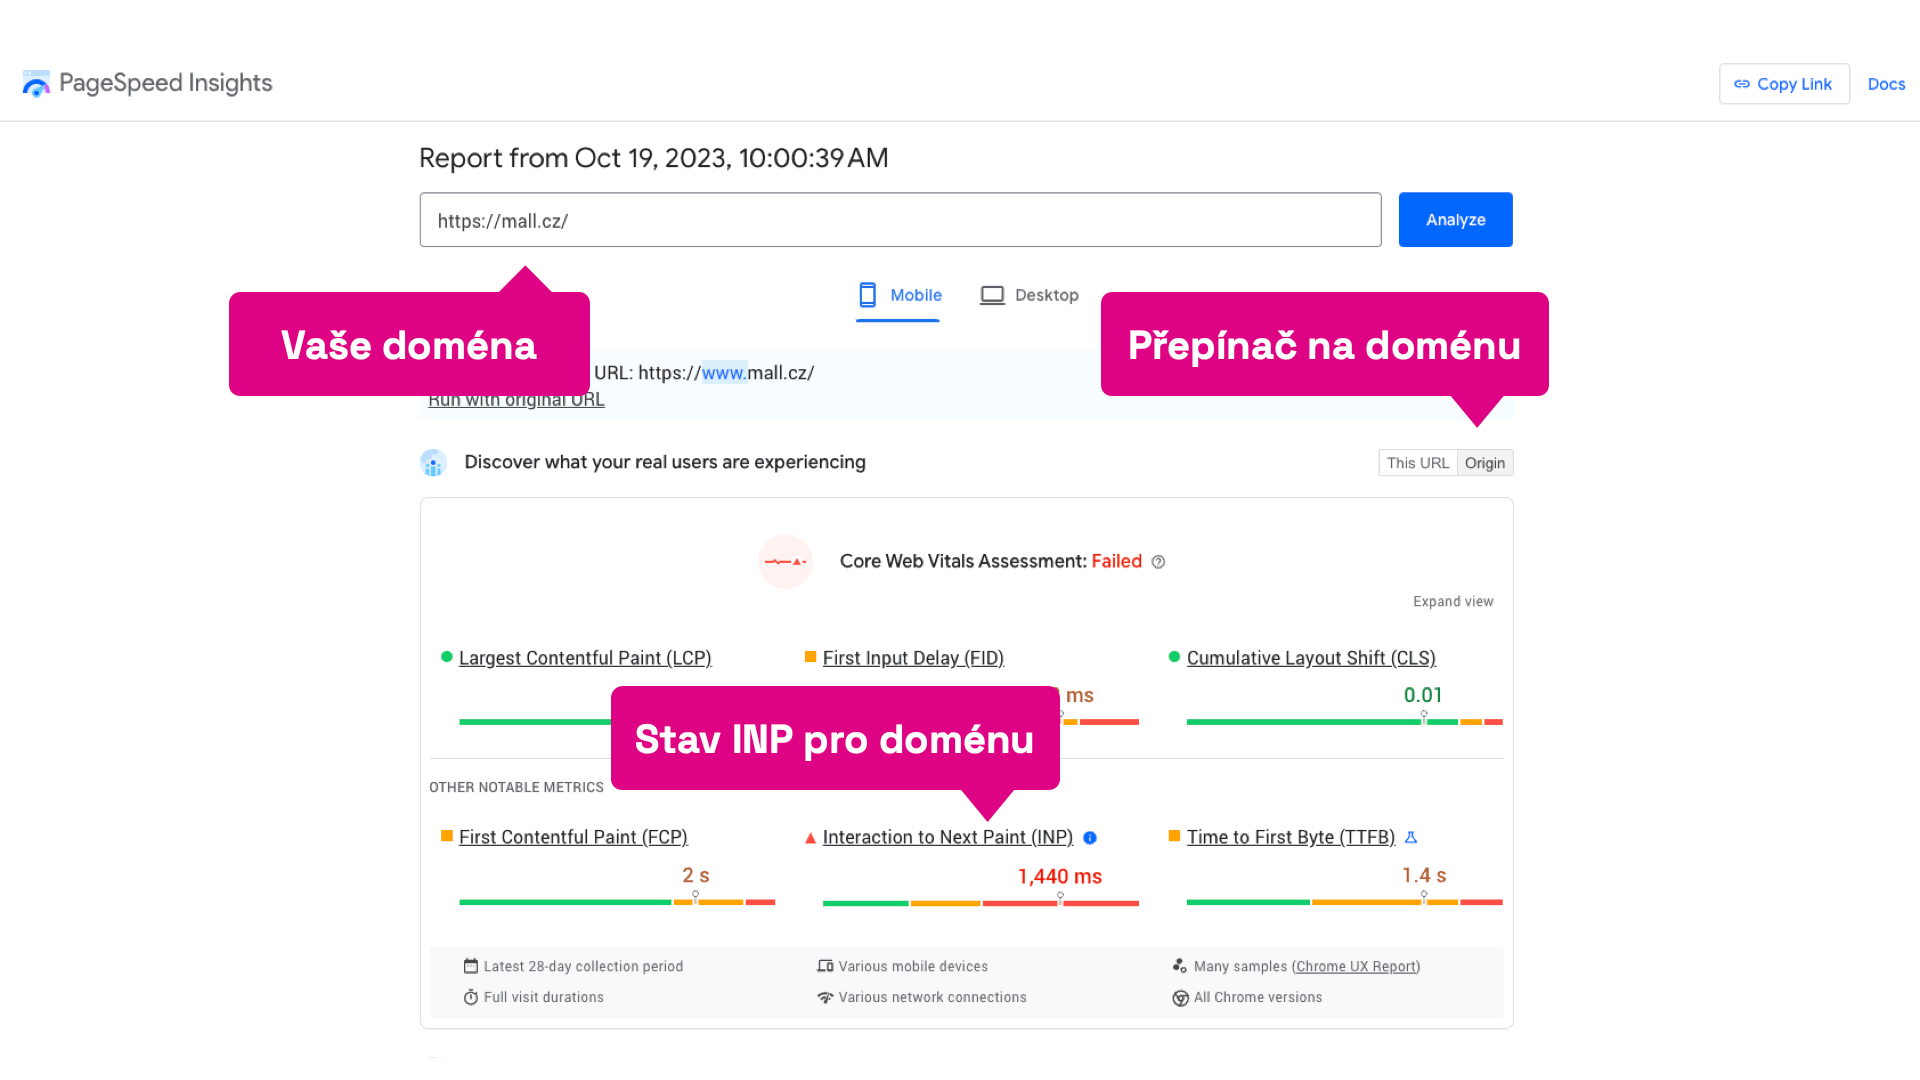
As described above, INP uses data from the Chrome UX Report (CrUX). It includes data for the entire domain as well as for individual URLs. For easier work, use one of the available tools that can work with CrUX data and visualize it, such as our PageSpeed.cz tester or Google PageSpeed Insights.
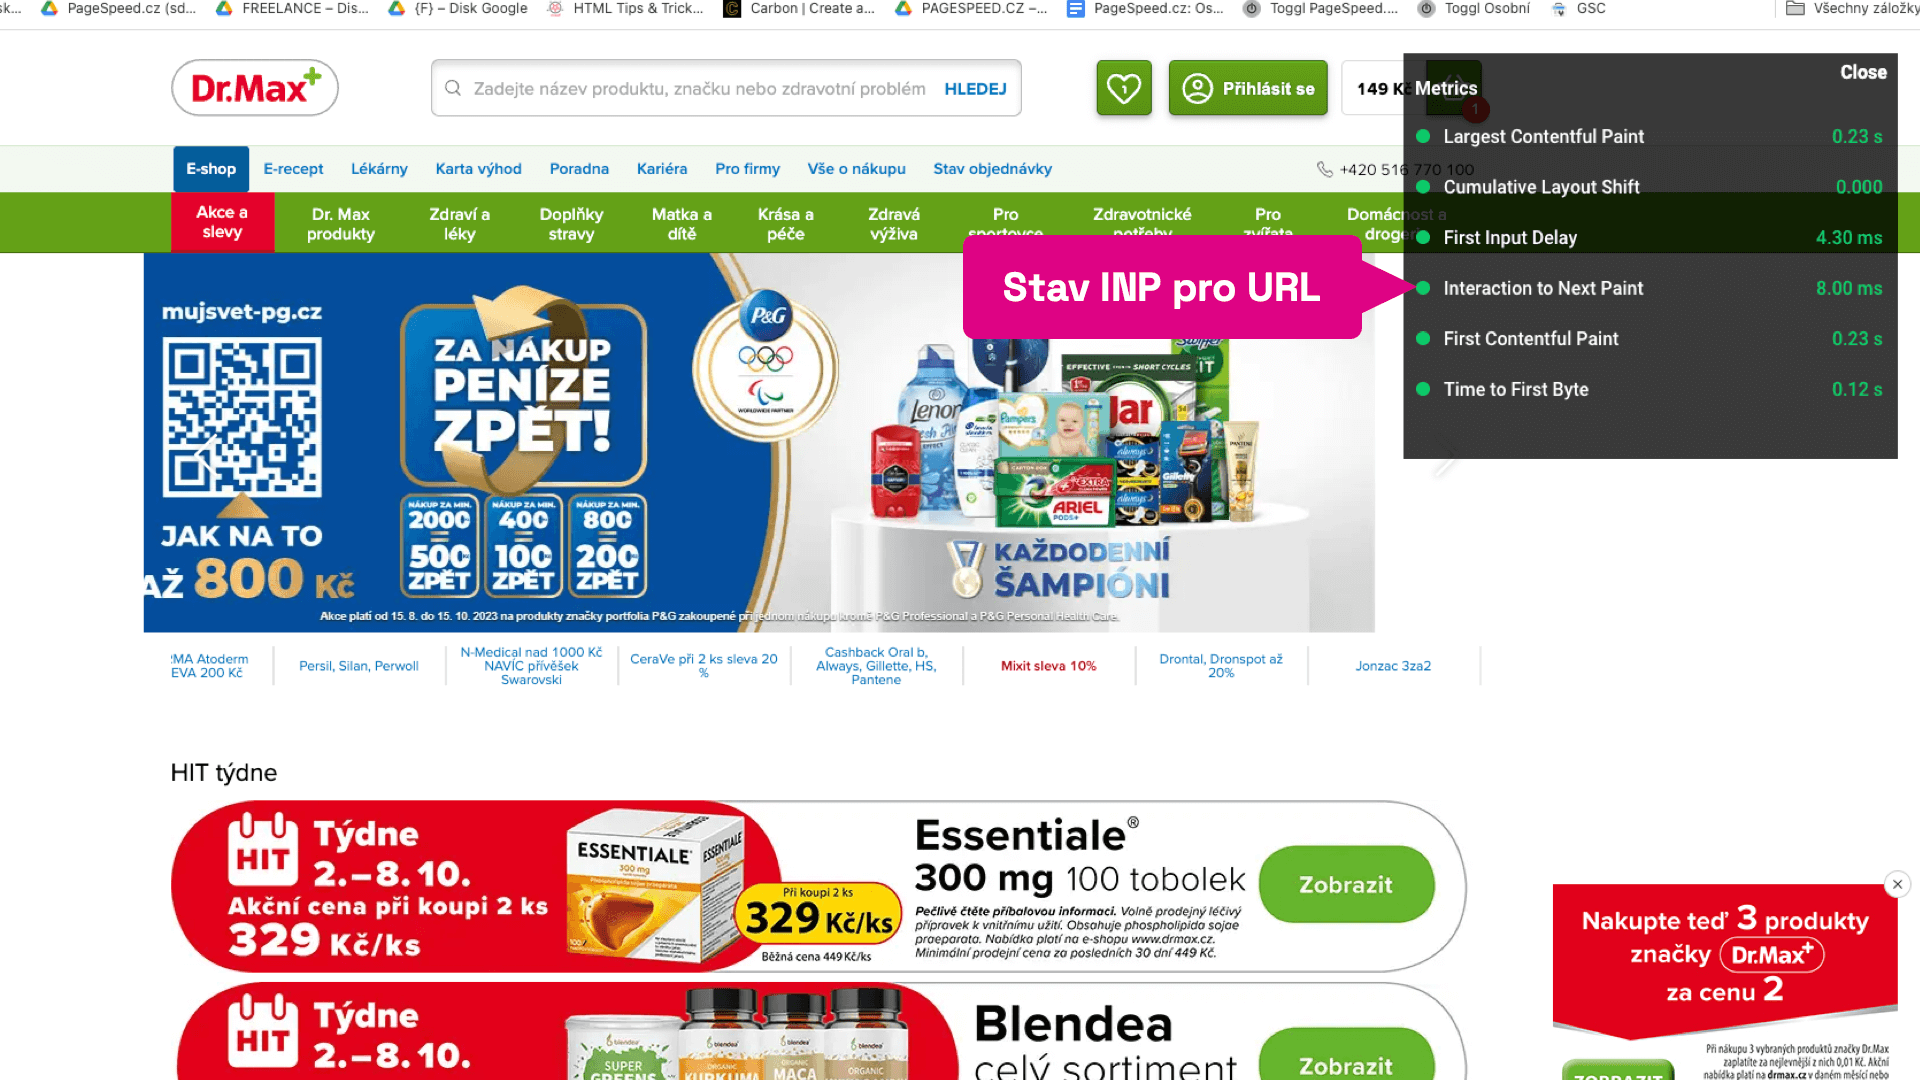
PageSpeed Insights shows the current Core Web Vitals metrics for mobile and desktop. You can also view data for a specific URL or the whole domain. The middle line is what interests us most, since that’s the INP value.
 Measuring INP
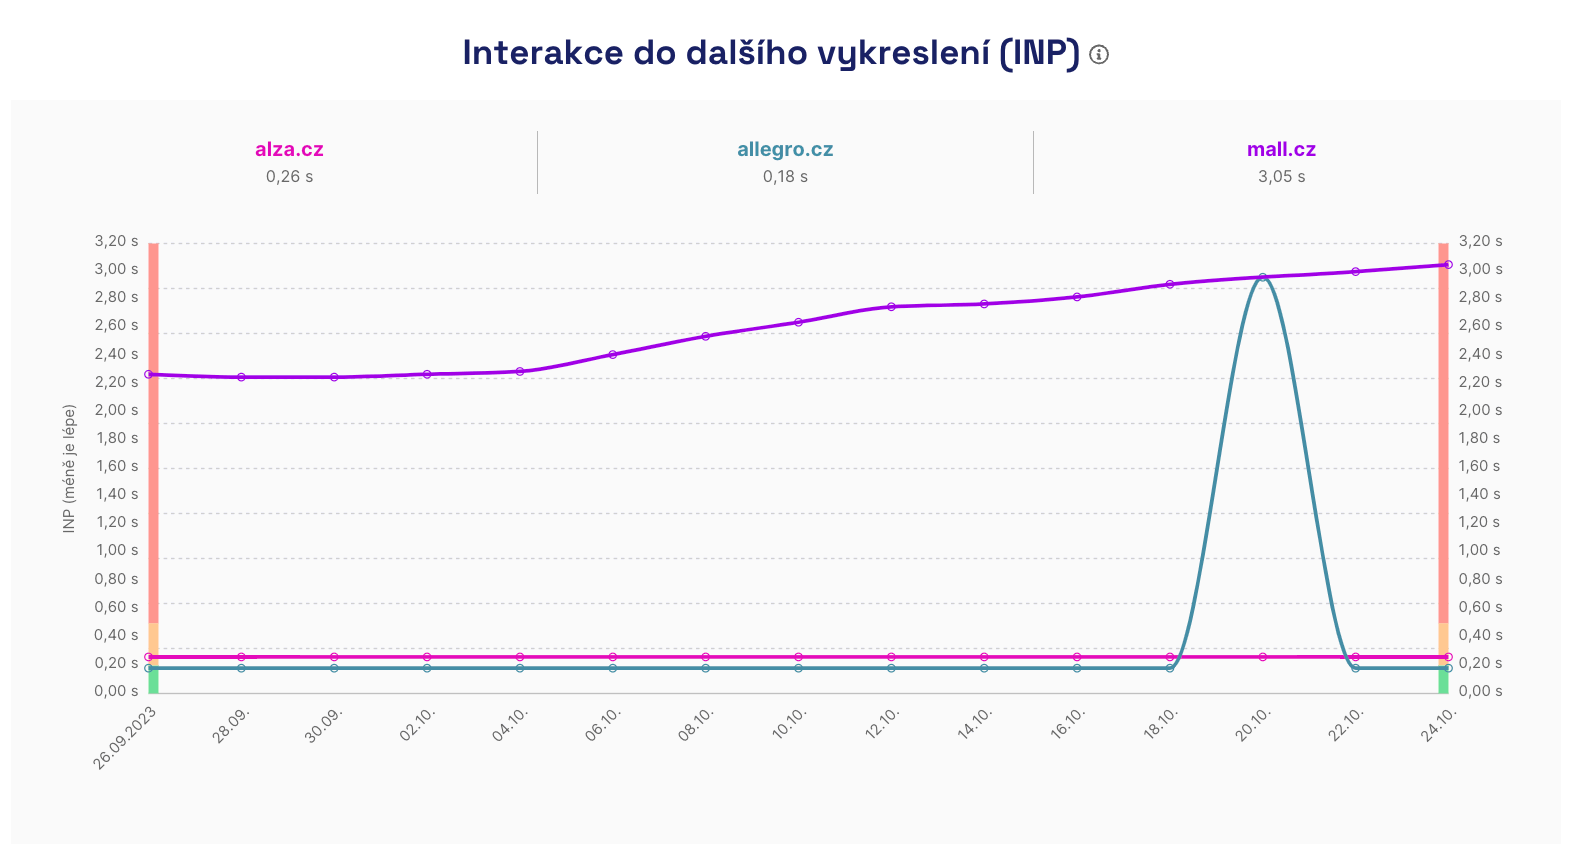
Long-term trends and regular changes on the site require a different approach, which is offered by our PageSpeed.cz tester. You can track metric values over a long period.
 INP metric in our tester
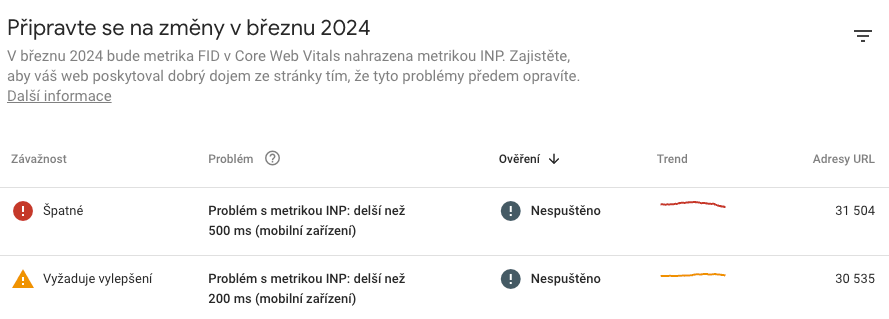
A very handy tool for monitoring Core Web Vitals is also Google Search Console, where you’ll find URL groups with reported metrics. This makes it easier to pinpoint potentially problematic URLs.
 Google Search Console
If Chrome-only measurement is too limiting, you can always measure with Real User Monitoring (RUM), or write your own data collection using JavaScript and the Performance Observer API.
Synthetic measurements are also available via tools like PageSpeed.cz, Google Lighthouse, WebPageTest, and similar. However, you’ll only get metrics similar to JS Long Tasks there, not INP itself, since INP comes from real users.
For differences between measurements, see our dedicated page: synth vs. CrUX vs. RUM.
I have INP issues—what now?
If you’ve reviewed CrUX user data reports and checked Google Search Console to see groups of URLs flagged as problematic, it’s time to identify the issues. Move to testing tools or try in-browser testing (which we do) to pinpoint exact trouble spots.
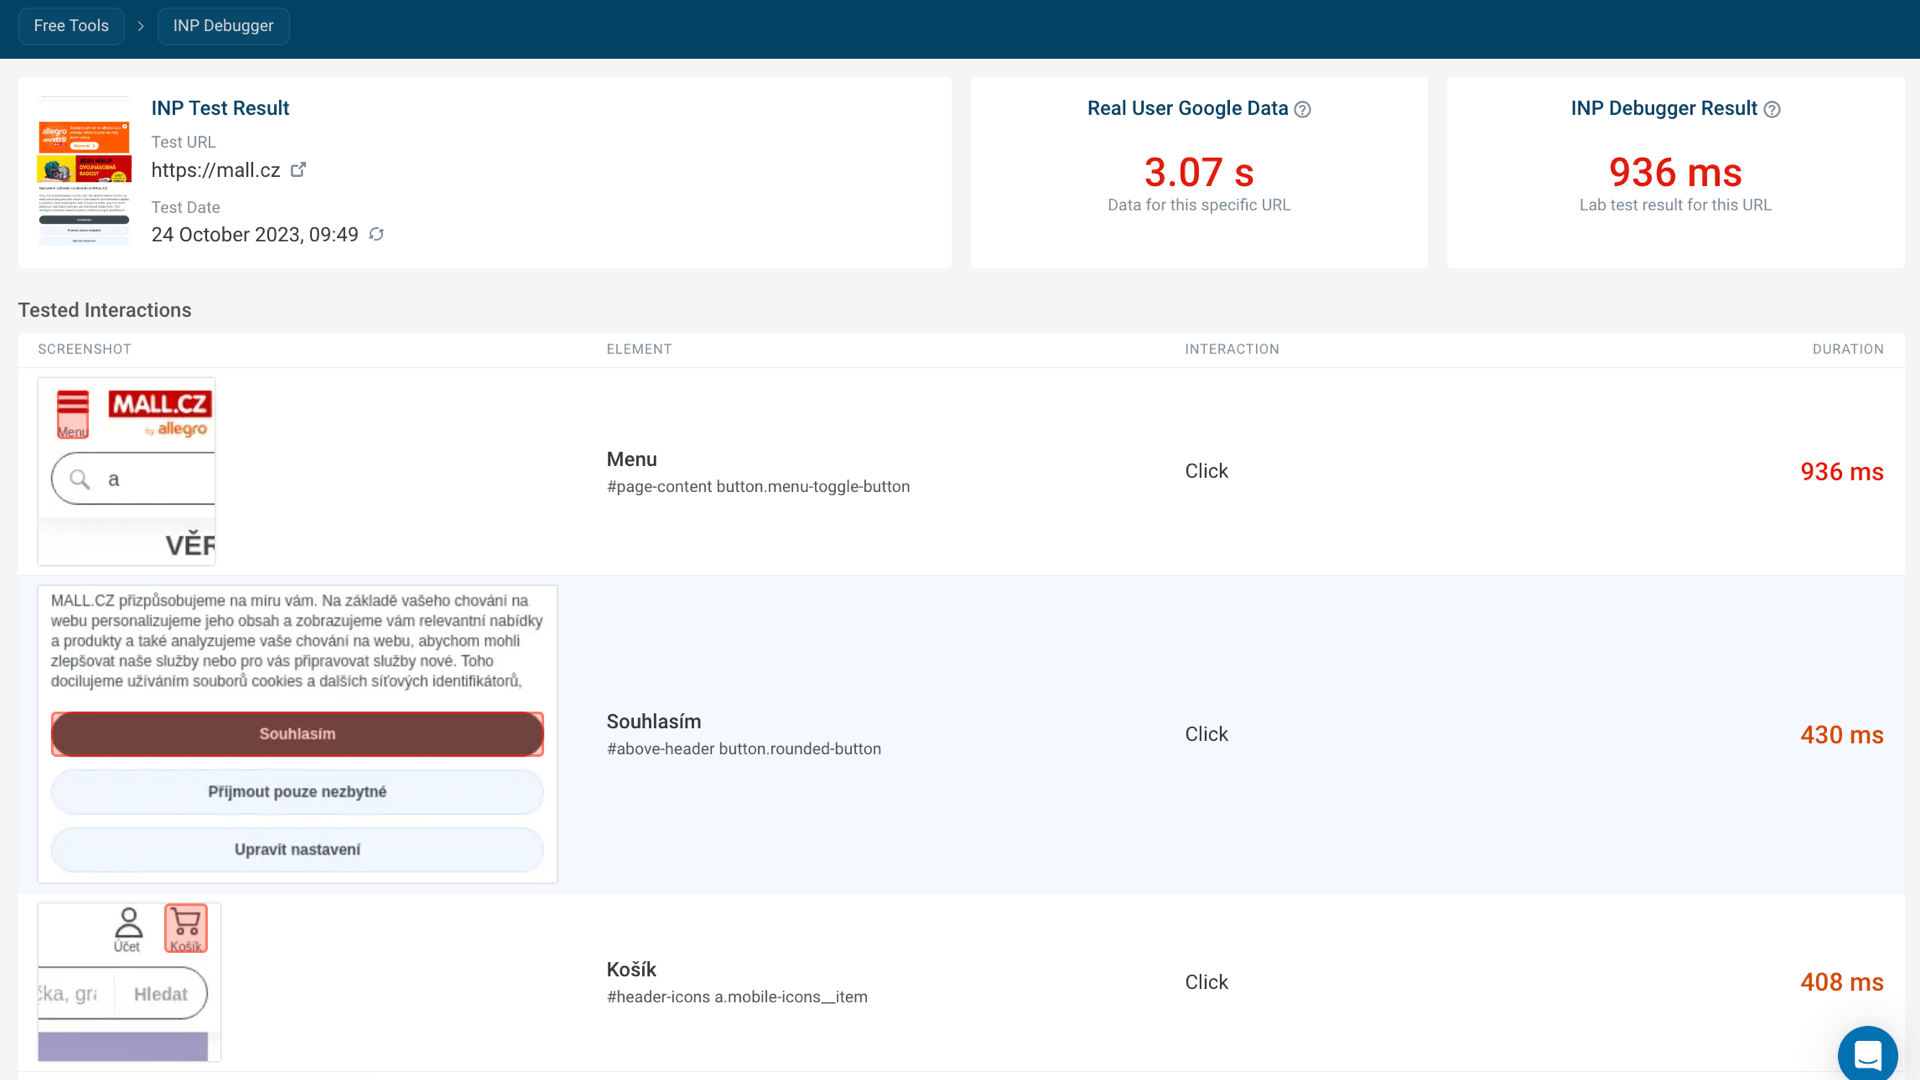
For a quick look at interactions, try INP Debugger. It’s not perfect, but it can help surface long interactions.
 INP Debugger
INP Debugger won’t measure interactions buried in hidden elements, so run multiple tests to understand how a page behaves. The output lists interactions sorted by measured INP time.
A great helper is the Chrome Core Web Vitals extension, which can log all metrics to the console. Open DevTools, go to the [Performance] tab, and set CPU slowdown to 6x and Network to Fast 3G to slow down the device for testing.
 Chrome Core Web Vitals extension
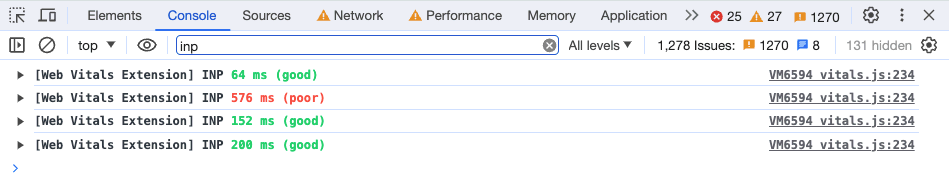
In the final step, go to the Console and enable the Core Web Vitals extension. Now you can test individual pages. Try all scenarios and interactive elements; the INP value will be logged to the console.
 Chrome Core Web Vitals - console output
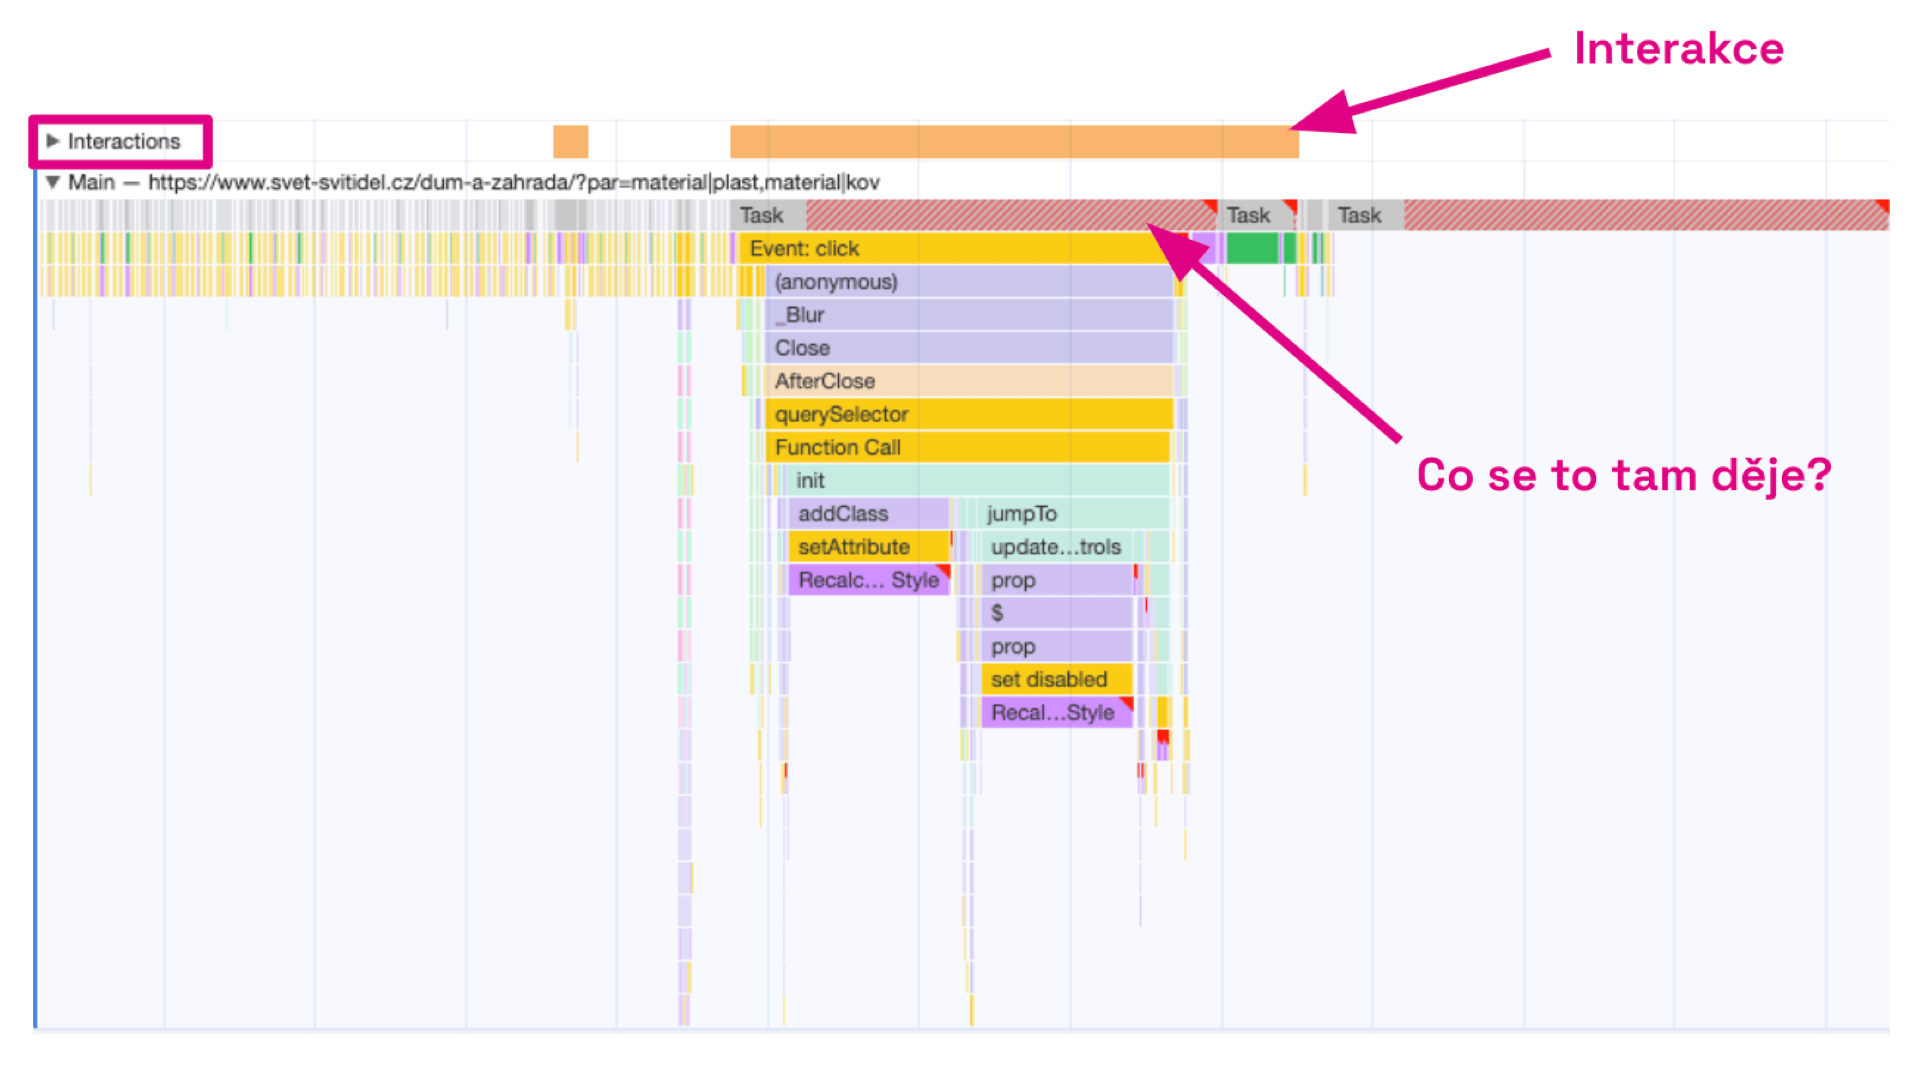
For a deeper breakdown of a specific interaction, record a Timeline in the Performance tab. If you record a particular interaction, you’ll see exactly when it occurred in the Interactions section.
 Performance tab - timeline
The Main tab shows the scripts and methods that explain “What’s going on there?”
Common mistakes and optimization options
INP is primarily a JavaScript metric, but many issues can be resolved by UI tweaks as well. We have a dedicated article on INP optimization, but here are a few core options.
Don’t keep users waiting for a response
After a user interaction, the UI should reflect a visible update as quickly as possible. If an AJAX/Fetch request is in flight, users may not know something is happening. Provide immediate visual feedback by updating layout or showing a loading indicator.
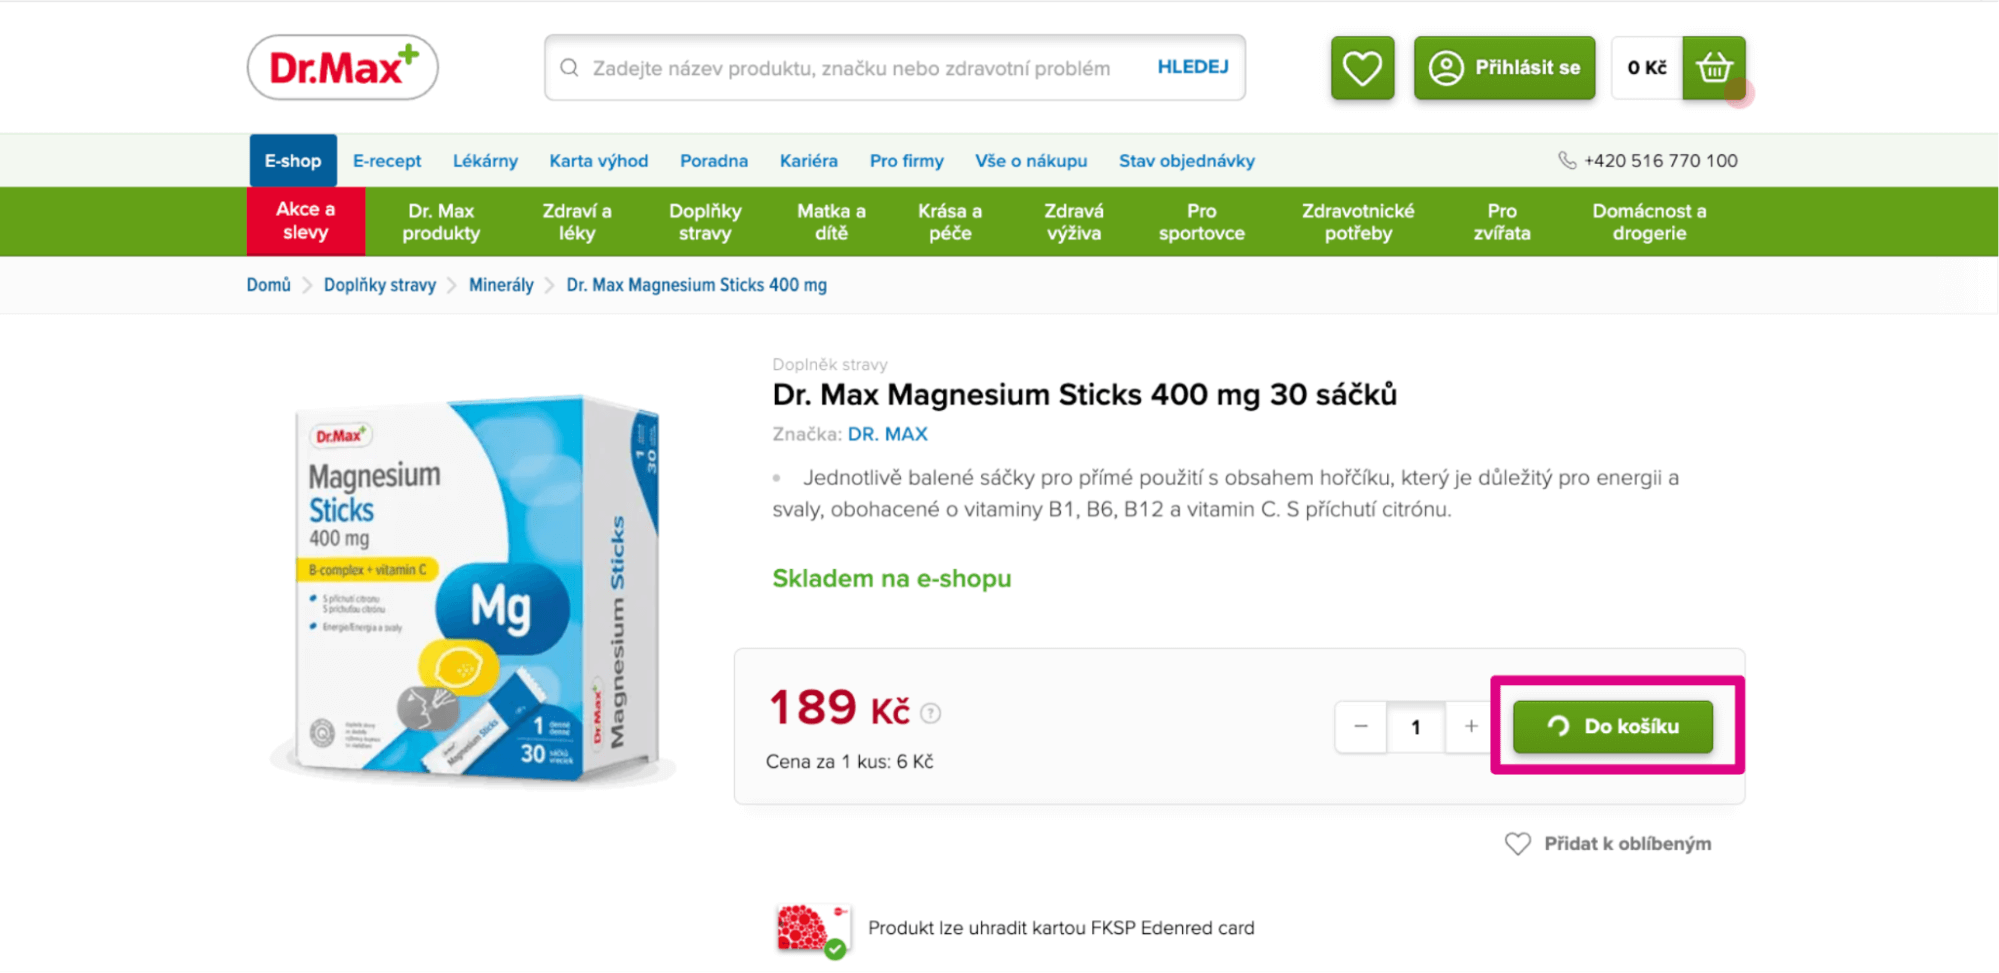 Don’t keep users waiting for a response
Don’t run JavaScript on click if you can postpone it
Delay events such as measurements and sending tracking code until the UI has responded. Long tasks triggered by, for example, GTM on a button click, can slow the UI and worsen INP.
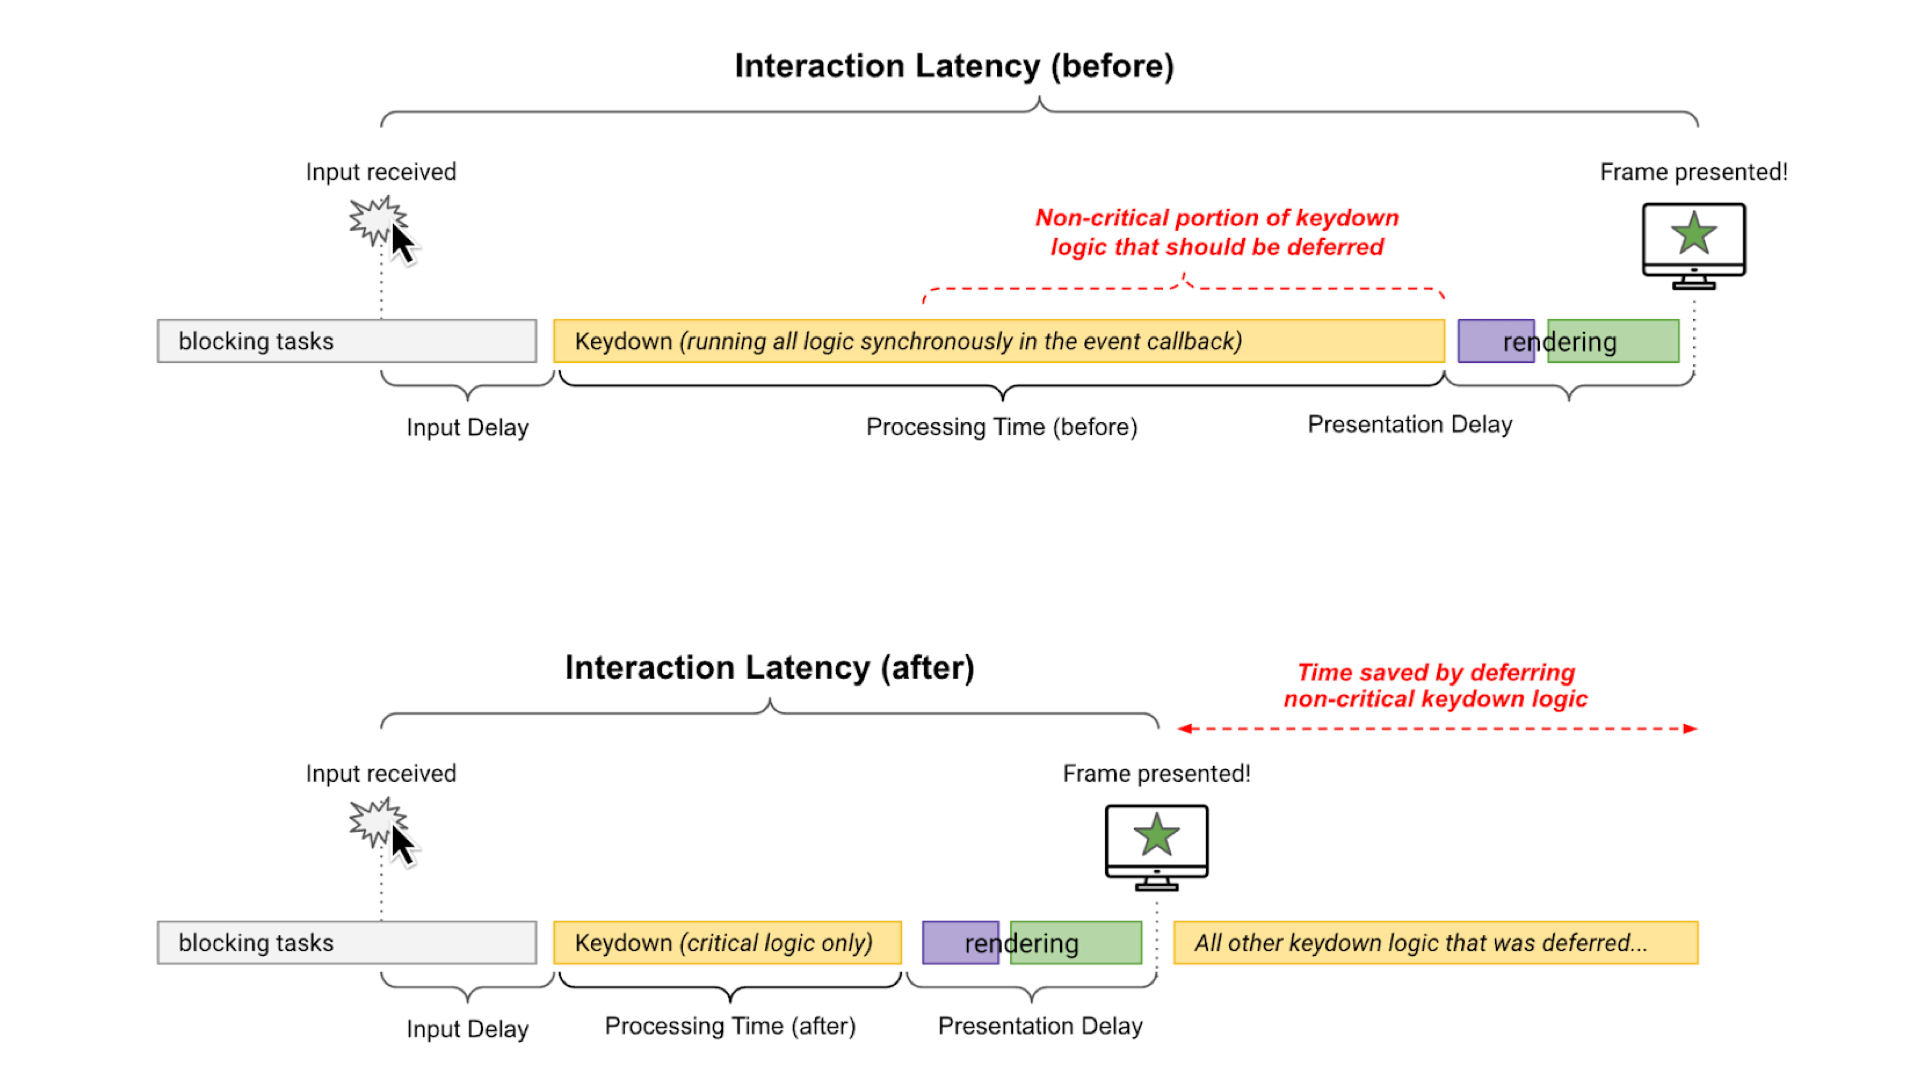 Delay non-critical JS on click
Eliminate long tasks (Long Tasks) in JavaScript
Long Tasks—JavaScript work that blocks the main thread—should be split into smaller tasks that run sequentially and don’t block the response. A simple way to break Long Tasks apart is to wrap code in a setTimeout.
document.addEventListener('DOMContentLoaded', function () {
	setTimeout(() => {
		// Call your functions here
	}, 0);
});
There are many optimization opportunities for INP; also consider:
- Optimizing Fetch/Ajax response times.
- Minimizing the DOM and using DOM lazy loading with content-visibility.
- In the future, explore scheduler.yield() and the Long Animation Frames API instead of setTimeout().
Want help with INP? Try our new SpeedSprint service.
What to remember about INP
- The Interaction to Next Paint (INP) measures a page’s overall responsiveness to user interactions by tracking the delays of all events across the visit.
- Target values: up to 200 ms; 200–500 ms requires improvements; above 500 ms is unacceptable.
- Google plans to make INP part of Core Web Vitals in March 2024, replacing FID.
- When optimizing INP, focus on eliminating long JavaScript tasks, avoid making users wait for submissions, and defer non-immediate JS code.
INP is part of our unified speed metric — the PageSpeed.cz Score (SPS).
Also see: INP optimization.
Tags:MetricsCore Web VitalsINPCrUX
PreviousFirst Contentful Paint (FCP)NextLargest Contentful Paint (LCP)