Metric: Third-Party JavaScript Blocking Time (3PBT)
3PBT stands for Third-Party Blocking Time. It’s a slowdown metric that third-party components can cause during user interactions.
This is an internal PageSpeed.cz monitoring indicator that helps you focus on issues caused by third-party components, which can degrade the Interactions (INP) metric.
🔐 This metric is shown only to PLUS test users in the Pages report.
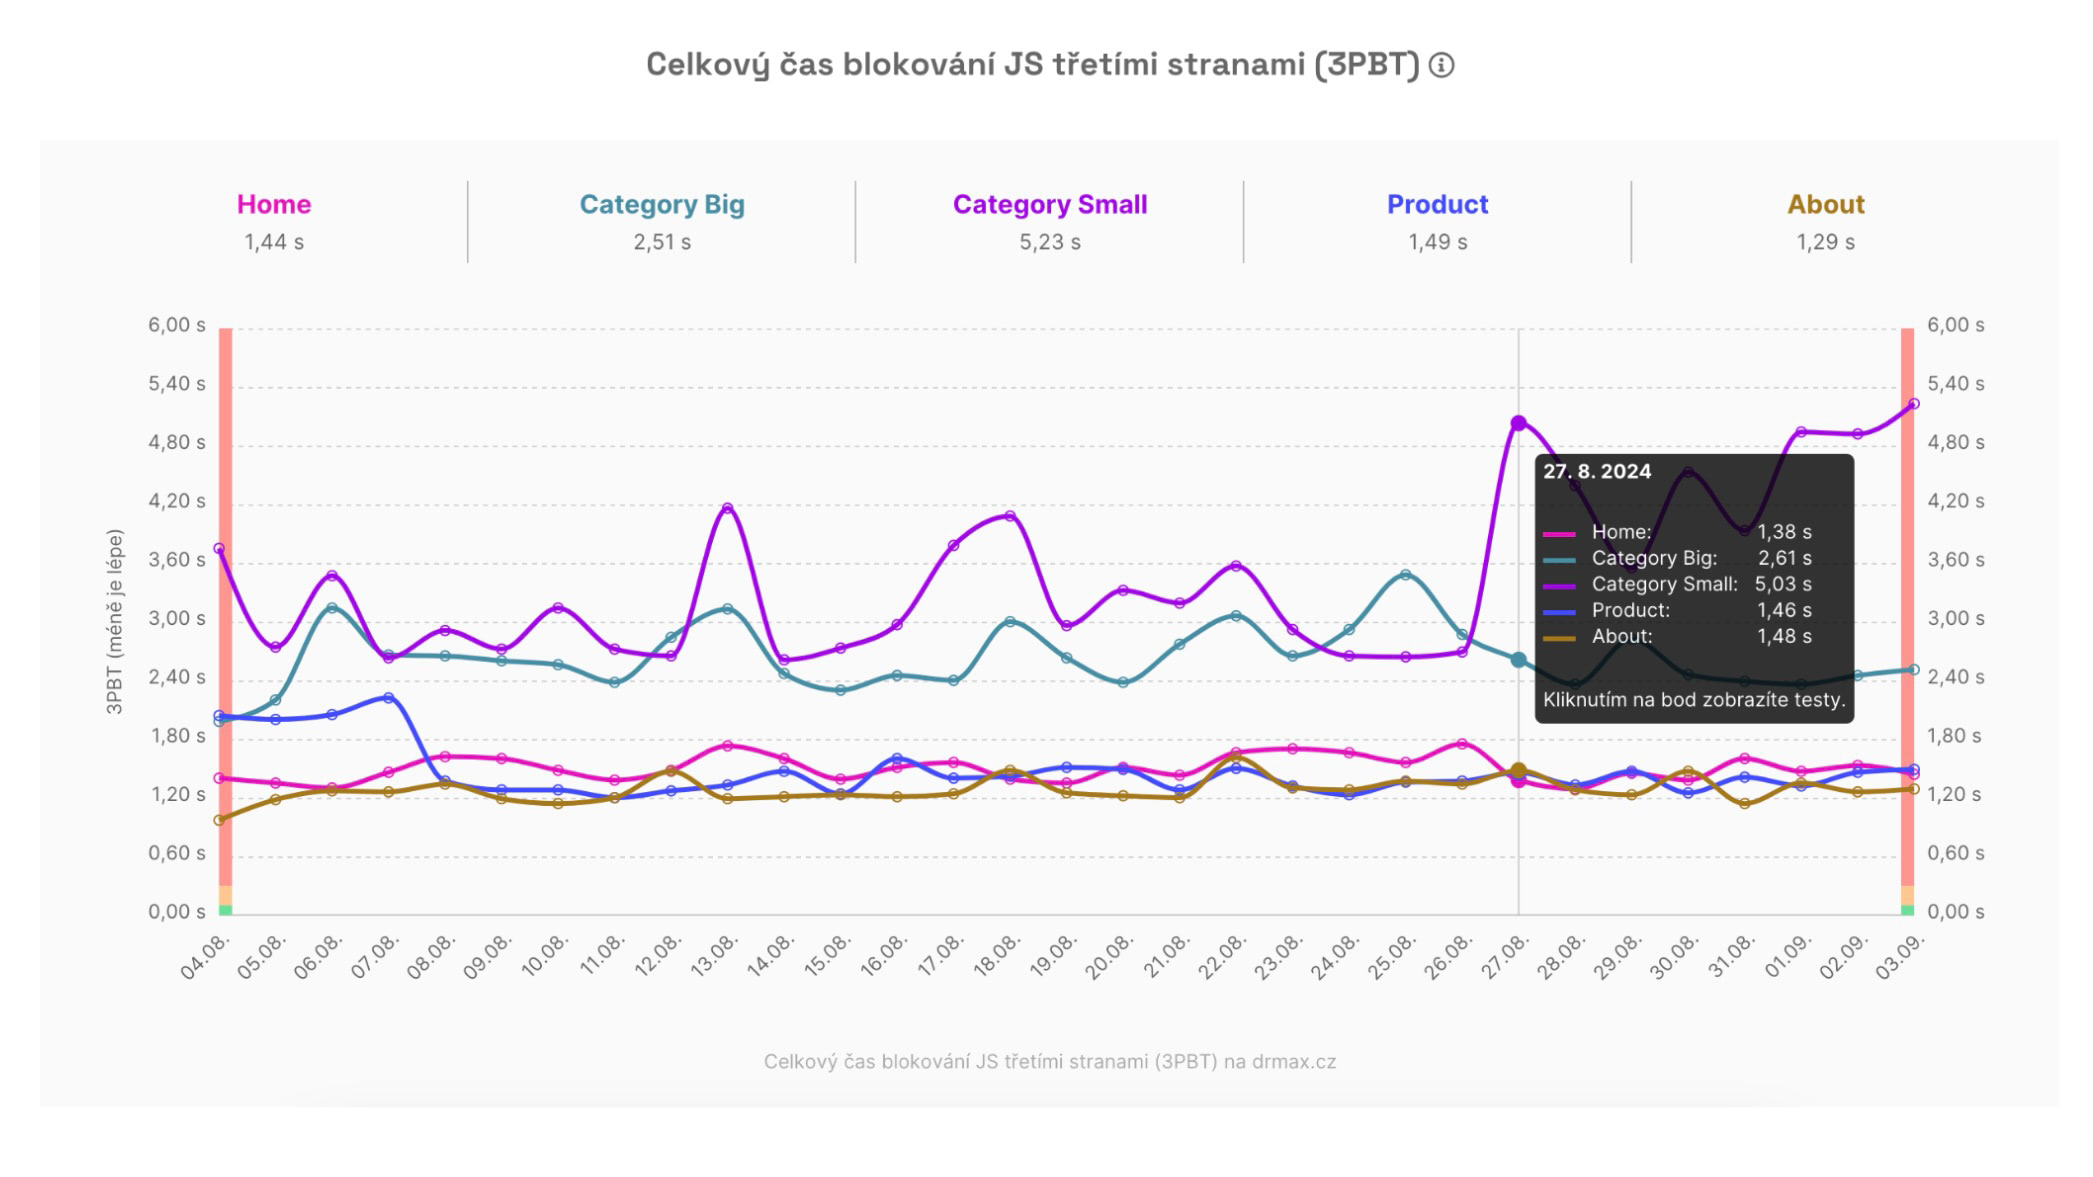 3PBT metric chart: Which pages are affected by third‑party components?
How exactly is 3PBT calculated?
Technically, 3PBT sums the times between the First Contentful Paint (FCP) and Time To Interactive (TTI) during which third-party JavaScript blocked the browser for more than 50 ms, delaying user interactions.
In other words, it’s a portion of the Total Blocking Time (TBT) metric caused by third-party scripts (analytics, A/B testing, etc.).
Interactivity slowdown, not page load
Note that 3PBT focuses on interactivity delays, not page load slowdown (which is measured by LCP).
A page can render quickly even with many third-party components because these are typically loaded with lower priority and asynchronously, so they don’t block rendering.
3PBT becomes especially useful when diagnosing issues that slow interactivity. INP measures these interactivities. If INP on your site (in the Domains report) is outside the green range, also check the 3PBT values.
How do we detect third parties?
Third-party scripts are automatically detected by Lighthouse, which we use for our synthetic PLUS tests (see How we measure). This detection may not be perfectly precise.
Lighthouse is very good at identifying well-known third-party components (Google Tag Manager, Google Analytics, Hotjar…), but less so for rarer or locally developed components.
So, the displayed number may reflect only part of the true value. Still, it’s a useful indicator, especially when compared with the overall Total Blocking Time (TBT).
What is the optimal 3PBT value?
The optimal 3PBT value is up to 0.1 s (100 ms).
You don’t need to chase this if your measured URLs don’t reach that level. Use these questions to evaluate 3PBT:
- Is the domain-level INP outside the green range (see the Domains report)?
- If yes, check the Pages report to see which URLs have degraded INP or TBT.
- For those pages, compare 3PBT to TBT.
The goal is to determine whether third‑party components influence the overall blocking time (TBT) and, consequently, the interactions measured by INP.
How to identify which specific components have a negative impact?
The 3PBT chart shows the overall impact of third parties on particular pages.
If you want to know which exact third parties are causing issues, drill down into the Lighthouse report:
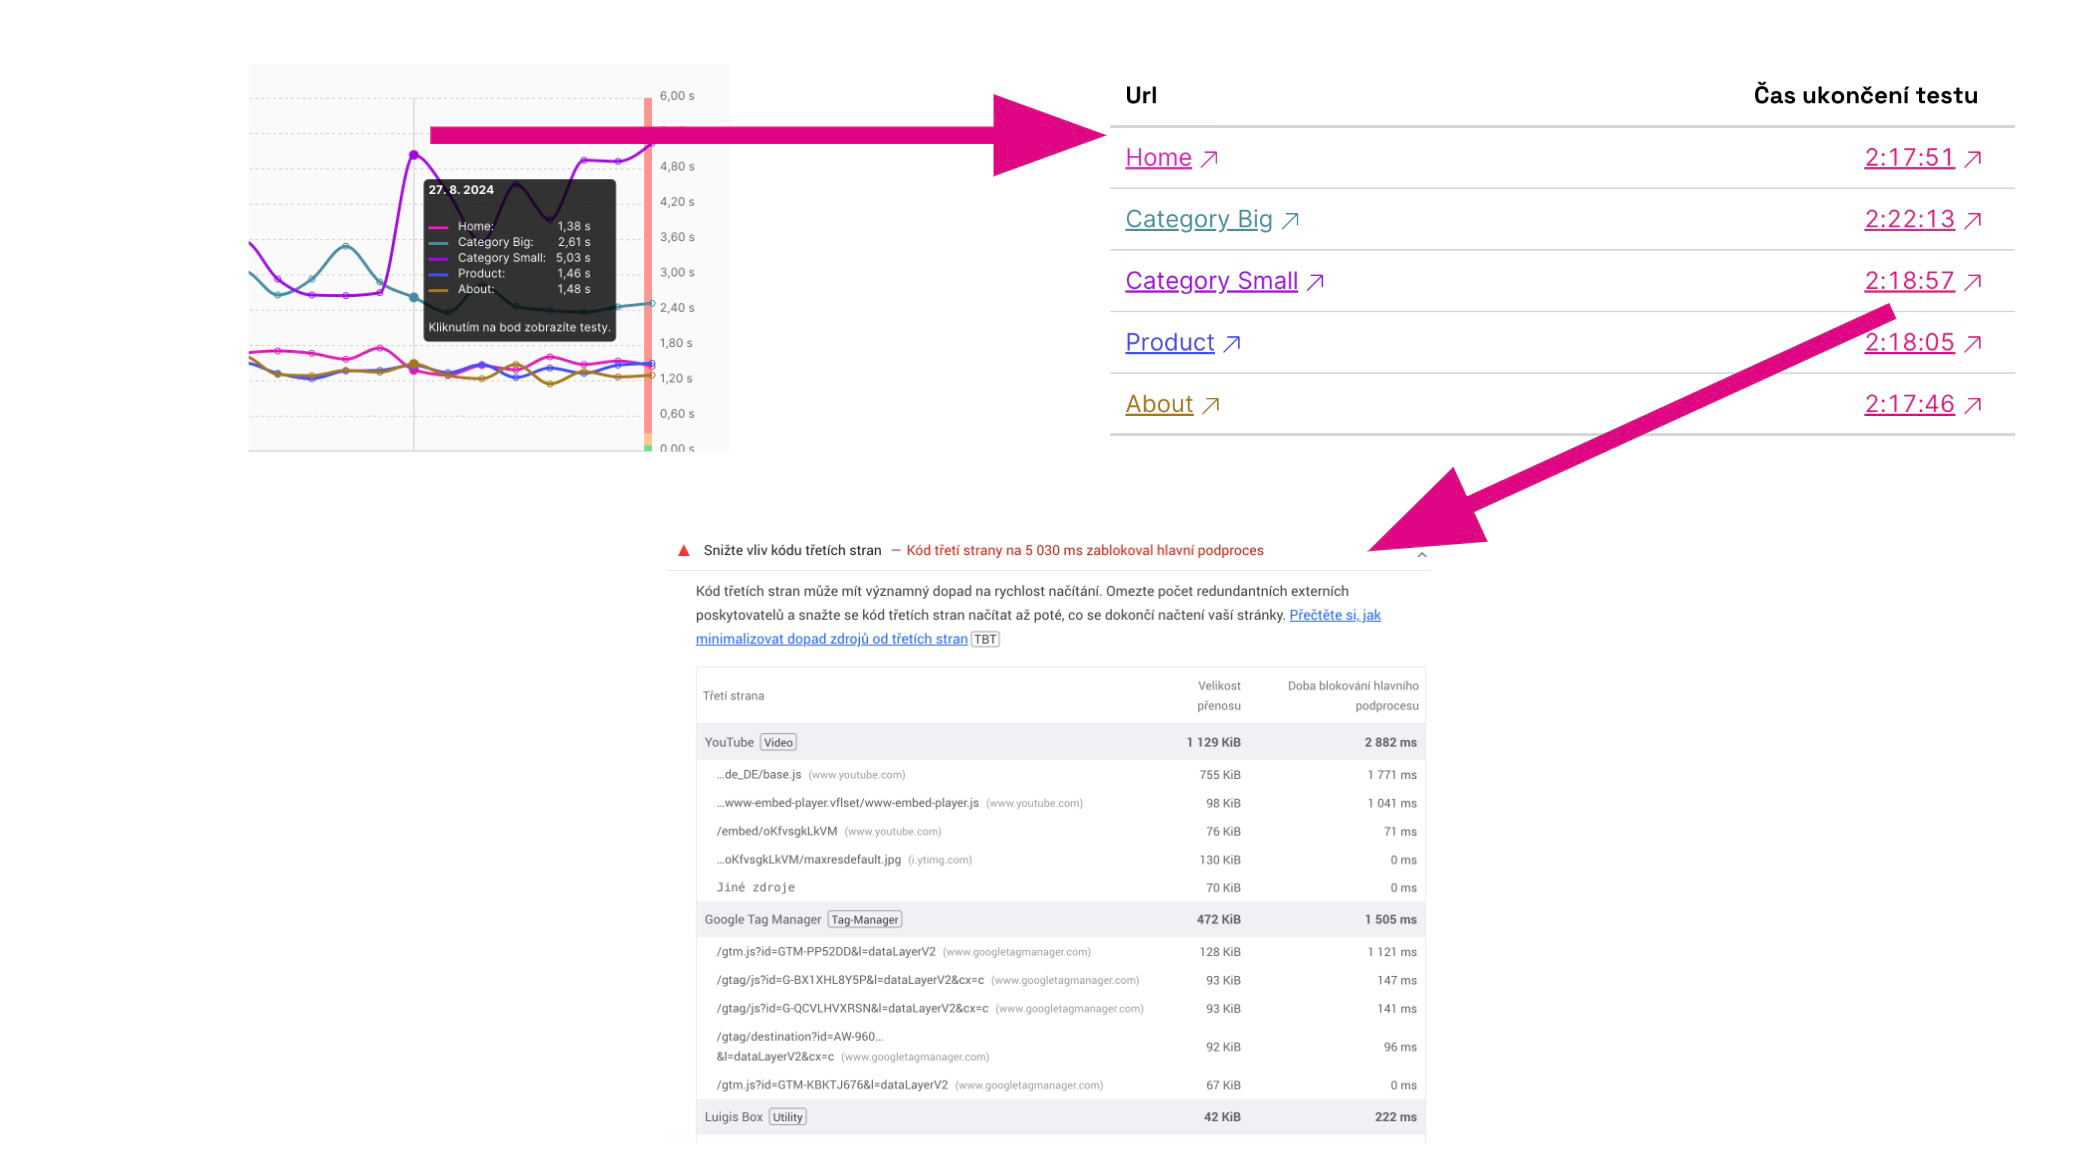 How to reach the report with the exact culprits behind 3PBT degradation?
Step-by-step:
- In the Pages report, find the 3PBT chart.
- Click a specific point on the chart.
- In the modal, select a specific URL.
- Click the test time.
- In the test run detail (Lighthouse report), look for the section “Reduce the impact of third‑party code.”
This will take you to the exact problematic components on specific pages.
How to optimize 3PBT?
Optimizing third-party component impact is complex, but practical options include:
- Consider whether you truly need that component on your site.
- Remove rarely used components (e.g., Hotjar) from the HTML when not in use.
- Optimize GTM code or use the setTimeout trick.
- For components that load in a specific page area, employ lazy loading.
- Stay in touch with the authors of third-party components.
More on optimizing third-party code can be found here:
- INP optimization — our help article.
- Optimizing third-party component speed — Vzhůru dolů (in Czech).
- Optimize third-party JavaScript — web.dev.