Watchdog Report
Watchdog monitors the speed of the measured pages on your website daily. If any key metric changes, Watchdog will alert you.
Unlike other tools, it does this automatically—no manual intervention and no spam.
🔒 Watchdog is a feature of the Monitoring Plus tests.
Watchdog consists of three components:
- The Watchdog report itself (this text)
- Watchdog notifications
- Watchdog status in the Report Summary
Watchdog report sections
The Watchdog report is available in every PLUS test under the “Watchdog” tab. It serves as the main dashboard for monitoring and reporting your site’s speed.
You can see its parts in the image below:
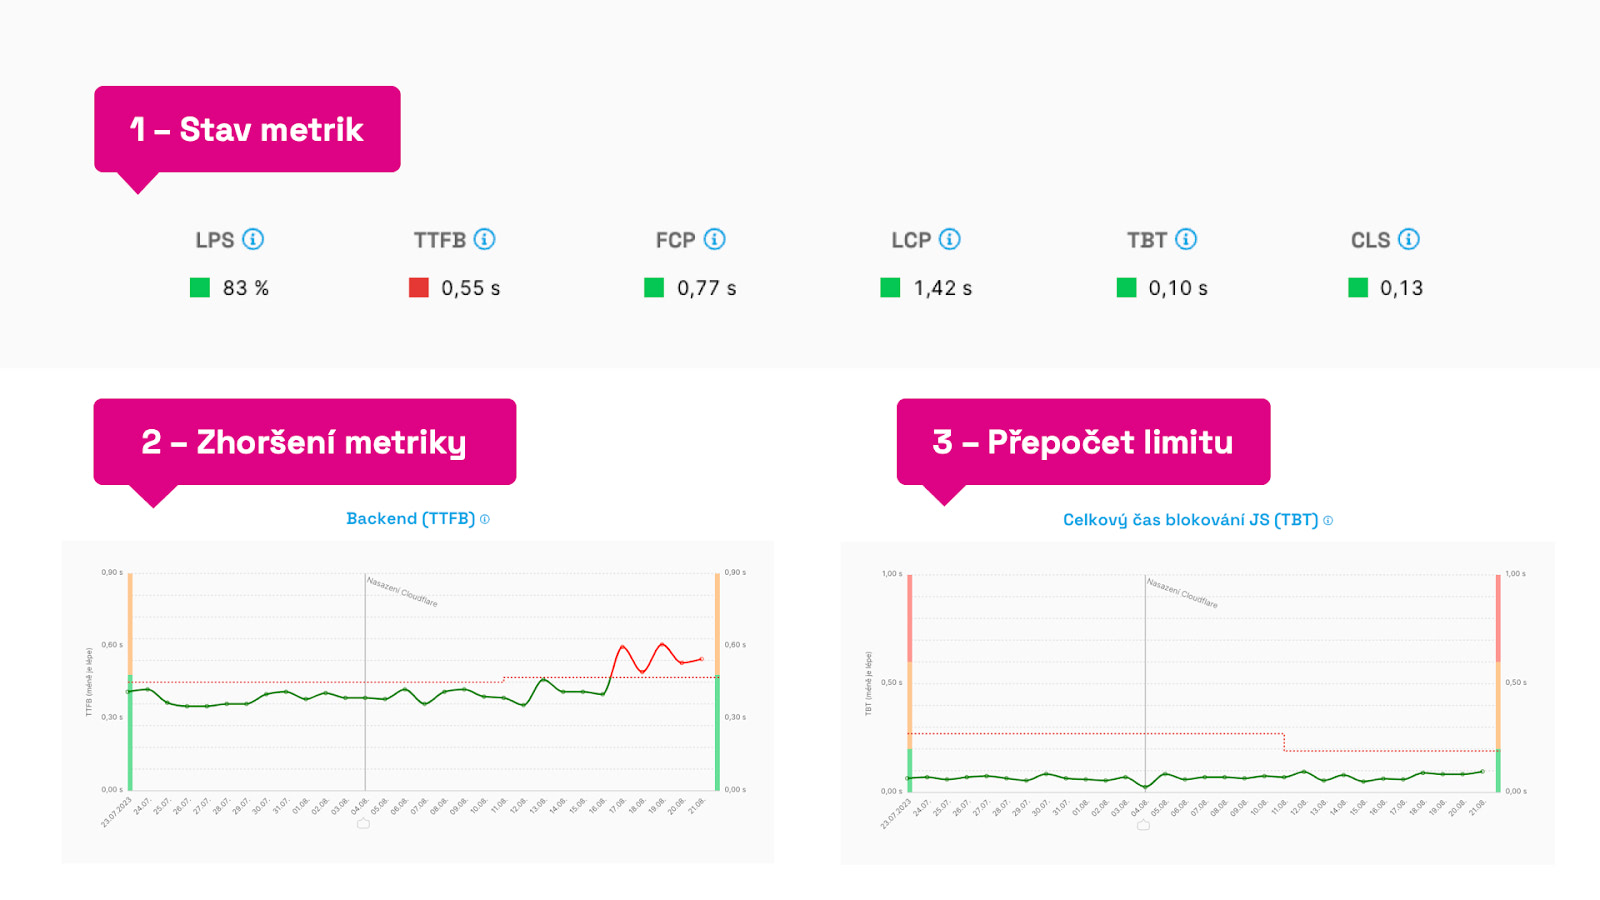 Different parts of the Watchdog report.
Let’s review the key elements:
-
Metric status - at the top in the “Watchdog Status” we display the tracked metrics and their current state. If they meet the configured limits, they’re green. “Broken” metrics appear red.
-
Metric deterioration - if the charts show a red line for several days, the limit for this metric has been breached. We recommend you pay attention. See below for more on root causes.
-
Limit recalculation - the metric limit, i.e., the dashed line in the chart, can auto-adjust if the metric has shown a good state for several days. Likewise, if a metric remains in a bad state, we won’t let it drift further. We always monitor current values to prevent deterioration.
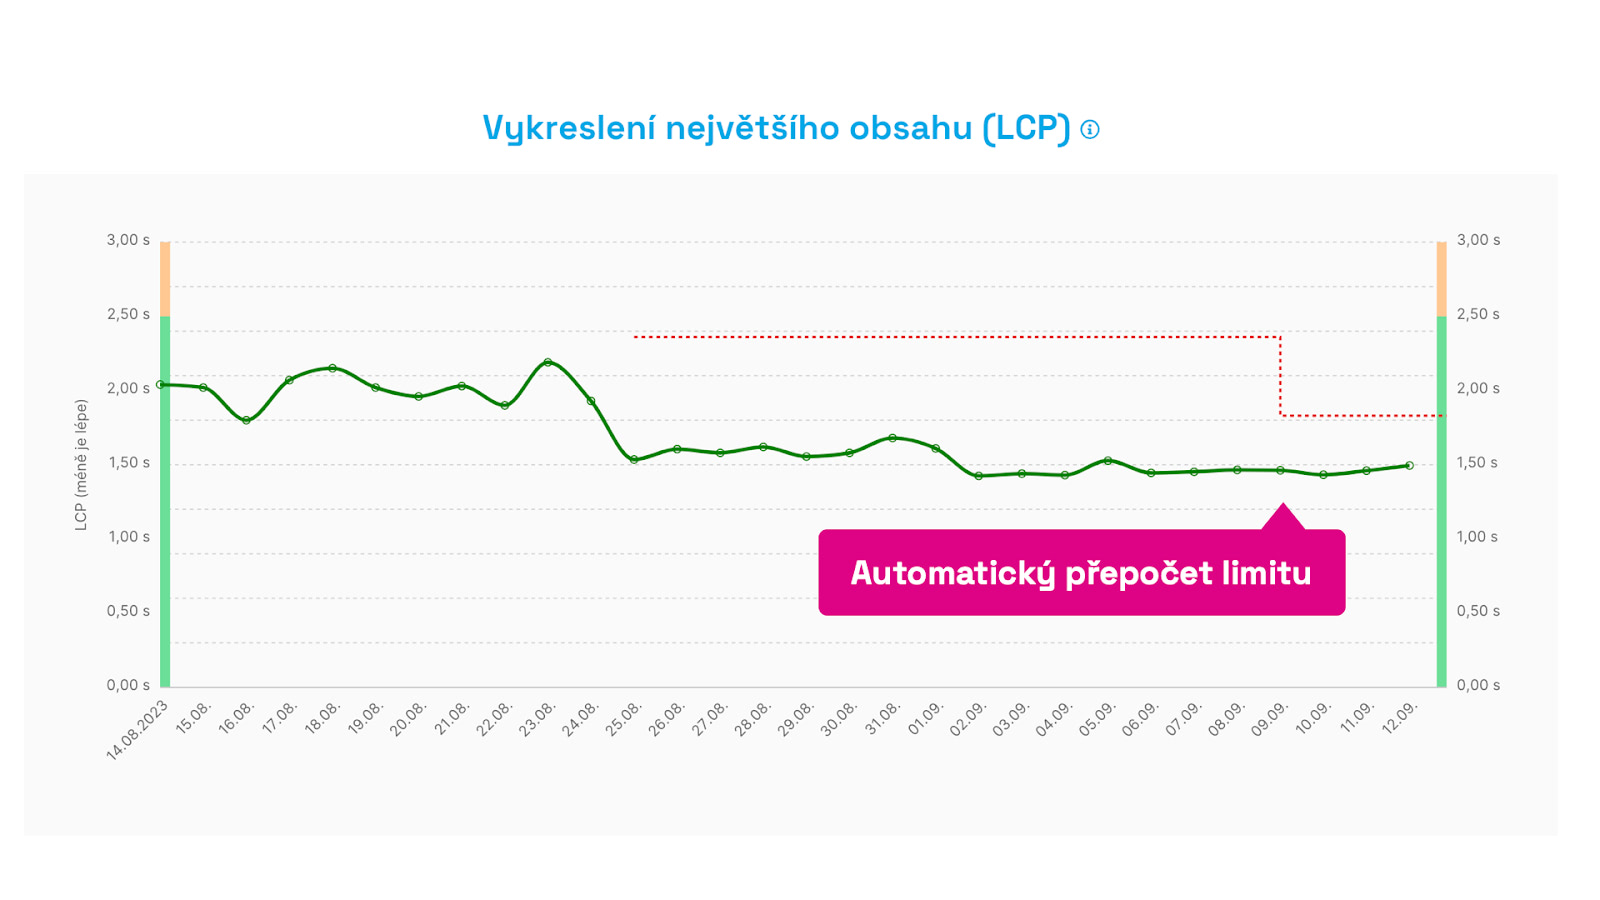 Automatic limit recalculation. After two weeks of improvement we automatically start monitoring the new metric value.
The key factors are the speed limit, the metric value itself, and timing. Now, let’s dive a bit deeper.
How exactly does Watchdog speed monitoring work?
Our goal was to have fresh data daily and to minimize irrelevant alerts.
Measurement method
Watchdog numbers are measured with Lighthouse, i.e., synthetically. We take the median measurement for each URL and derive an average from it. This has proven to be a sufficiently sensitive method for detecting meaningful changes on important website URLs.
Metrics
We selected Web Vitals metrics that can be measured synthetically (LCP, CLS) and supplement them with additional helper metrics such as TTFB (backend time) and TBT (total blocking time of JavaScript).
Measurement cycle
Speed monitoring runs in ten-day cycles. If a metric does not move above or below a defined value during the cycle, the limit stays as it was. If the value changes and persists for more than three days, we’ll notify you and highlight it in the chart.
Watchdog limit
In the chart the limit appears as a dashed line. The limit is always set above the metric threshold and has no ideal value; it simply reflects the previous state. This helps us reliably detect changes in metrics.
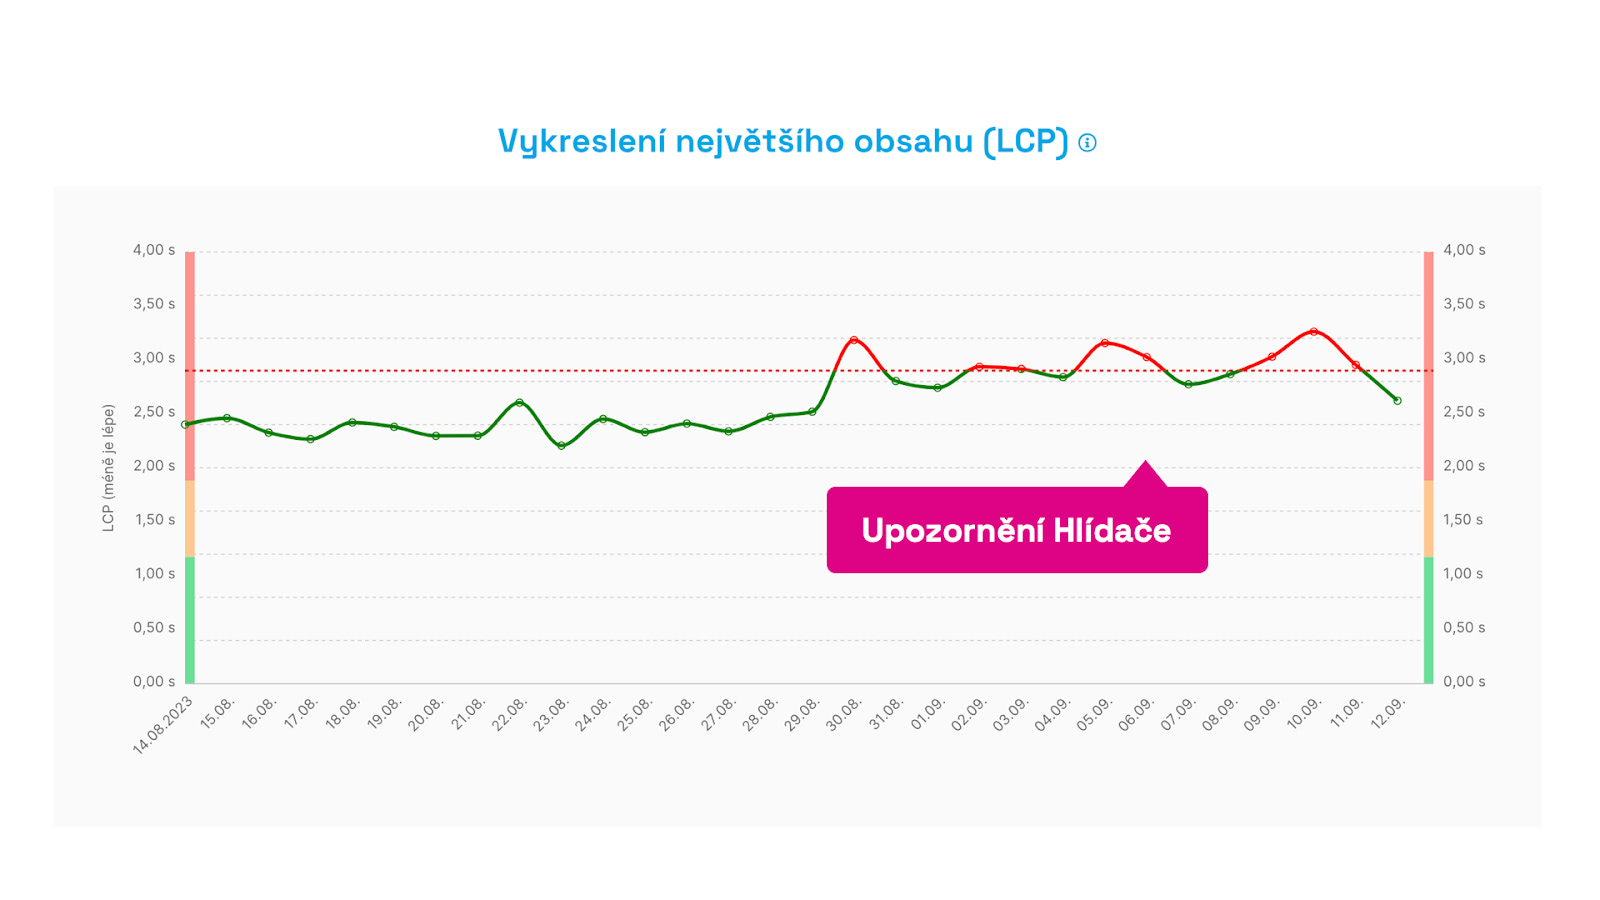 This is where something went wrong. You’ll receive an alert when a metric limit is breached for the third consecutive day. We avoid unnecessary alerts for single spikes.
Sensitivity of change detection
Note that after many iterations we discarded percentage-based change detection.
For example, a 10% change at a low metric value isn’t as meaningful as a 10% change at a higher value. Some metrics carry more weight (e.g., LCP as part of Core Web Vitals), while others are more volatile (e.g., TBT and other JavaScript metrics), so we tune limits with different sensitivities.
In our algorithm we use smart detections based on concrete values, recognizing that different metrics behave differently across ranges. The main goal? Minimize alerts for minor, insignificant changes.
What if I change a URL in Settings?
Changing or adding a URL within Settings will, by design, affect metric values and likely trigger an improvement or deterioration notification. When you change a URL, a note in the chart is automatically added.
How we designed the Watchdog?
PageSpeed.cz’s speed tester is developed from reviews of competing speed tools and, most importantly, years of experience monitoring site speed for dozens of clients through our speed optimization consulting.
This feature is sometimes referred to as Performance Budgets, but our approach works a bit differently. We want Watchdog to …
- be easy to use, even for non-experts,
- minimize information noise and unnecessary alerts,
- run automatically without constant tuning,
- be accessible across multiple communication channels.
Watchdog was created because no available tool adequately met our needs, nor those of our clients. How does Watchdog differ from PageSpeed.cz?
1) It sends only the essentials
Email alerts from existing monitoring tools will sooner or later flood your inbox. Only a subset contains meaningful and important speed changes. When we work with clients, we spend hours each week evaluating these notifications. Most alerts are false alarms; the notification didn’t need to come.
2) It focuses on meaningful metrics
Traditional tools cling to older metrics like page load time or invent their own metrics. We’ve long relied on metrics that truly reflect user experience. Our tester focuses on Web Vitals and supporting indicators.
Summary and recommendations
“Watchdog” and monitoring “performance budgets” are foundational to web performance work.
If you lack historical data on changes and their impact on speed, you’ll experience deterioration and incur high costs trying to diagnose the cause.
How to work with the Watchdog speed monitor?
- Get our [Monitoring Plus tests].
- Add important URL patterns in [Test Settings].
- In Settings, add your preferred channel for [Notifications].
- Track Watchdog status on the web, by email, Slack, or Teams.
- If changes occur, monitor CrUX data (e.g., in the Domains report). Synthetic Watchdog measurements can be more sensitive than needed; CrUX changes are the meaningful ones.
- If you notice larger changes after updates, add a note to the chart.
- To investigate other changes, use the [Pages] or [Technical] reports.
Also see how to evaluate Watchdog alerts.