Test Run Detail Report
The test run detail shows the results of testing a specific URL on your site.
The test run detail is designed for technically proficient readers who want the specifics of our Lighthouse speed test.
What you’ll find in the test run detail?
- Metric status for this run.
- Files with detailed logs.
- Recommendations to optimize speed.
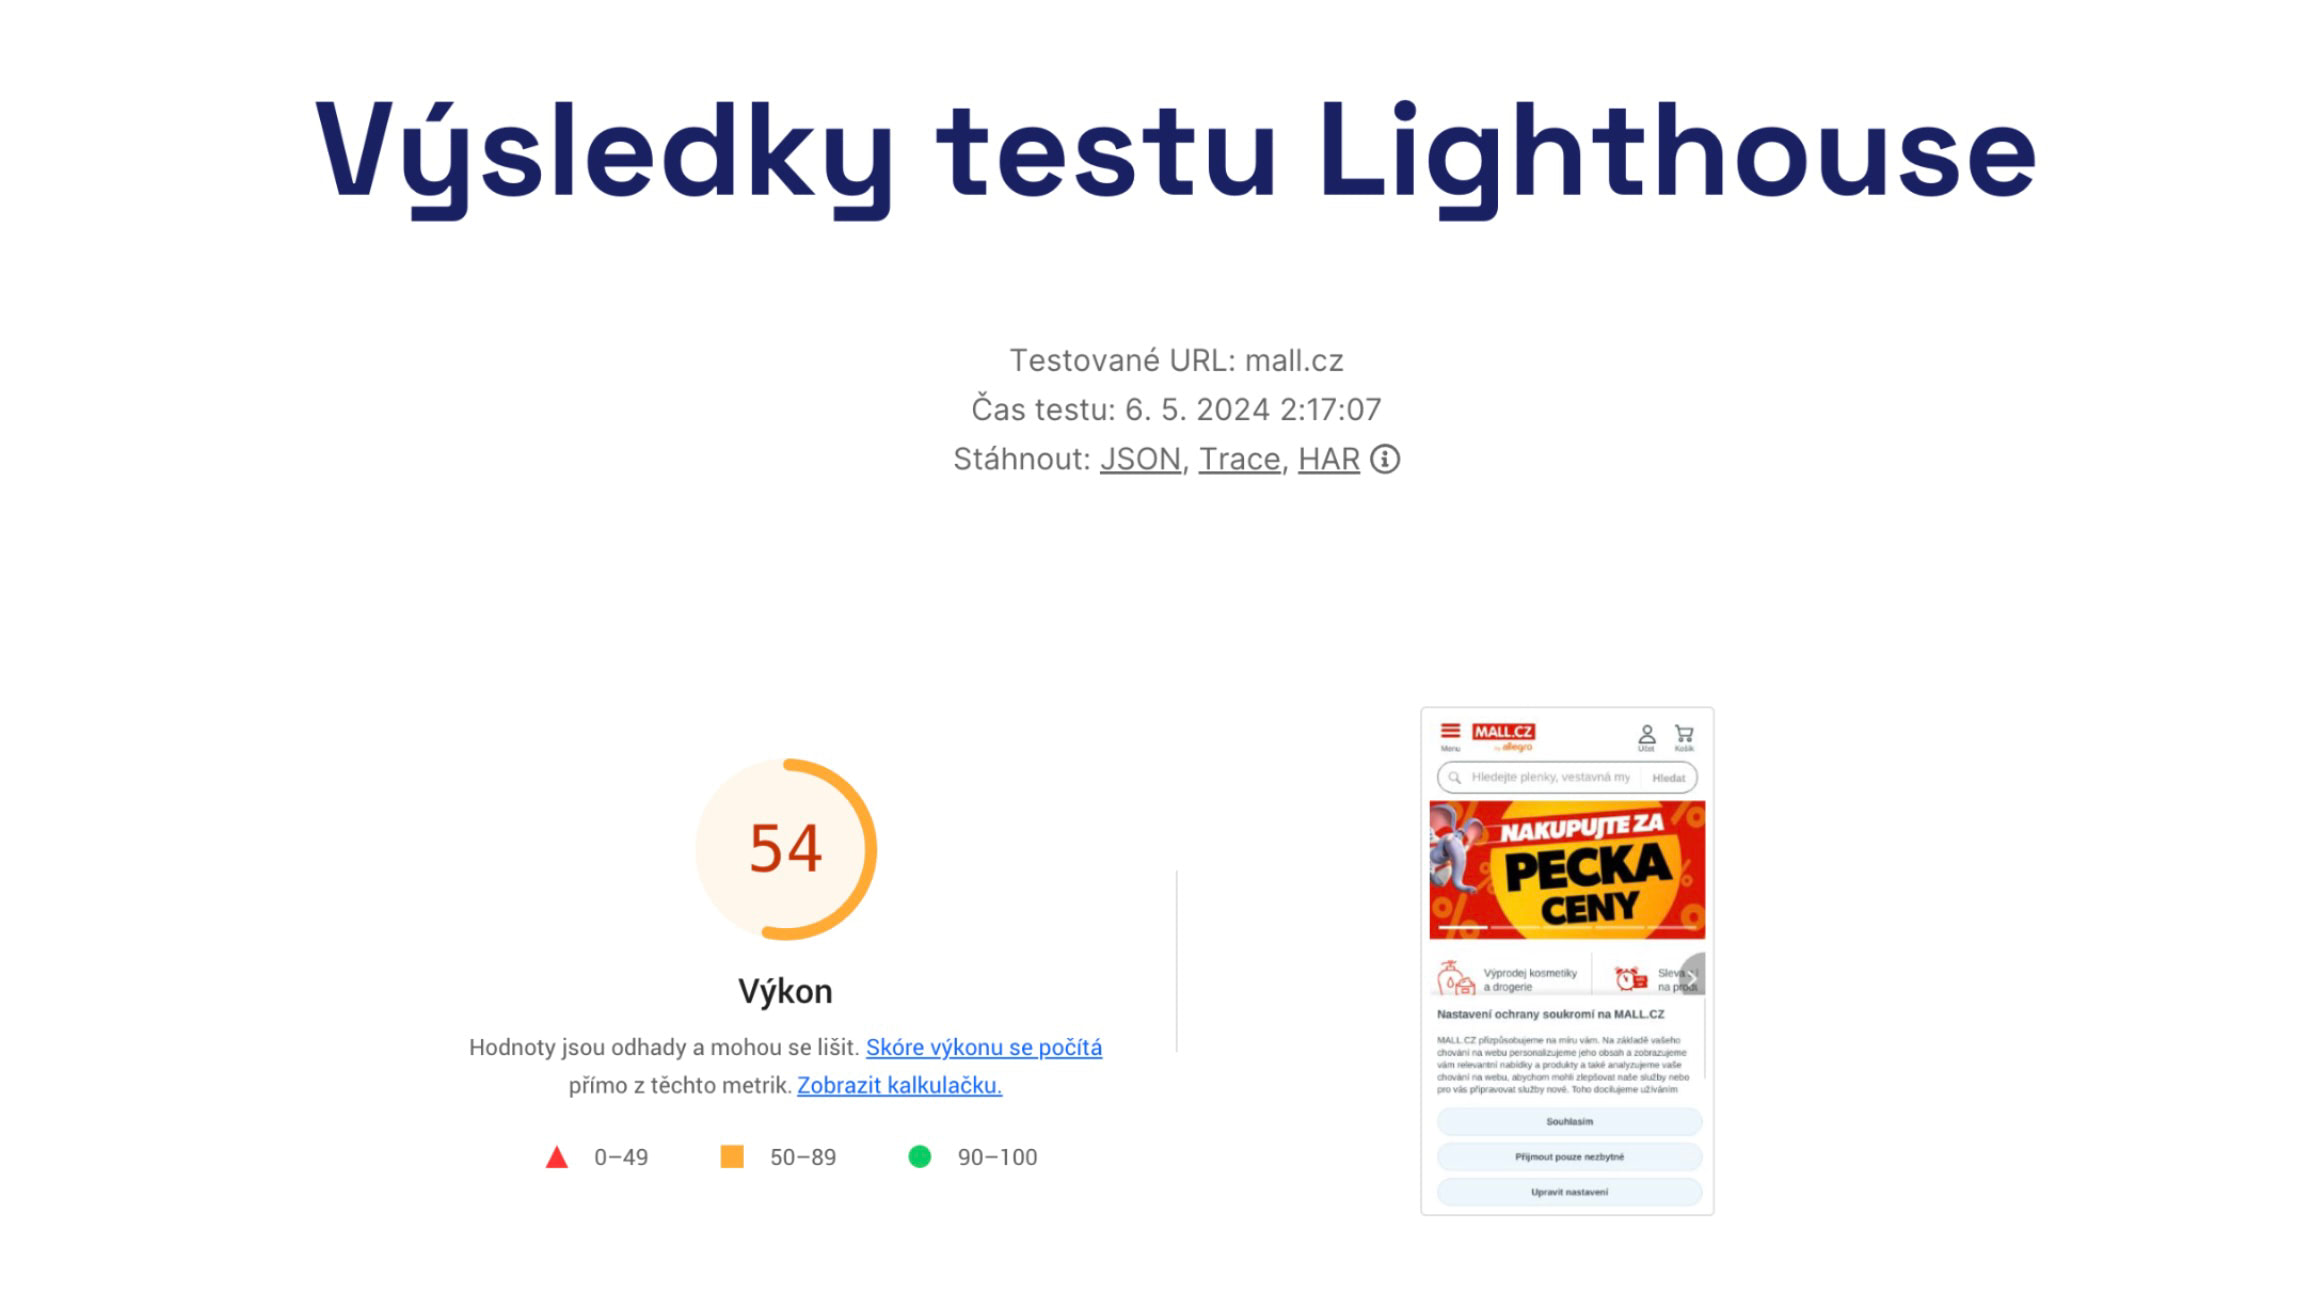 Test Run Detail.
Before you read further, understand the differences between synthetic, CrUX, and RUM web performance data.
It’s also helpful to learn how we test your websites in monitoring.
How to access the Test Run Detail?
You can view the Test Run Detail in the following ways:
- Click a point in the synthetic test results chart.
- In the open modal, click the test time for the specific URL.
- You’ll land on the dedicated URL for the test run detail.
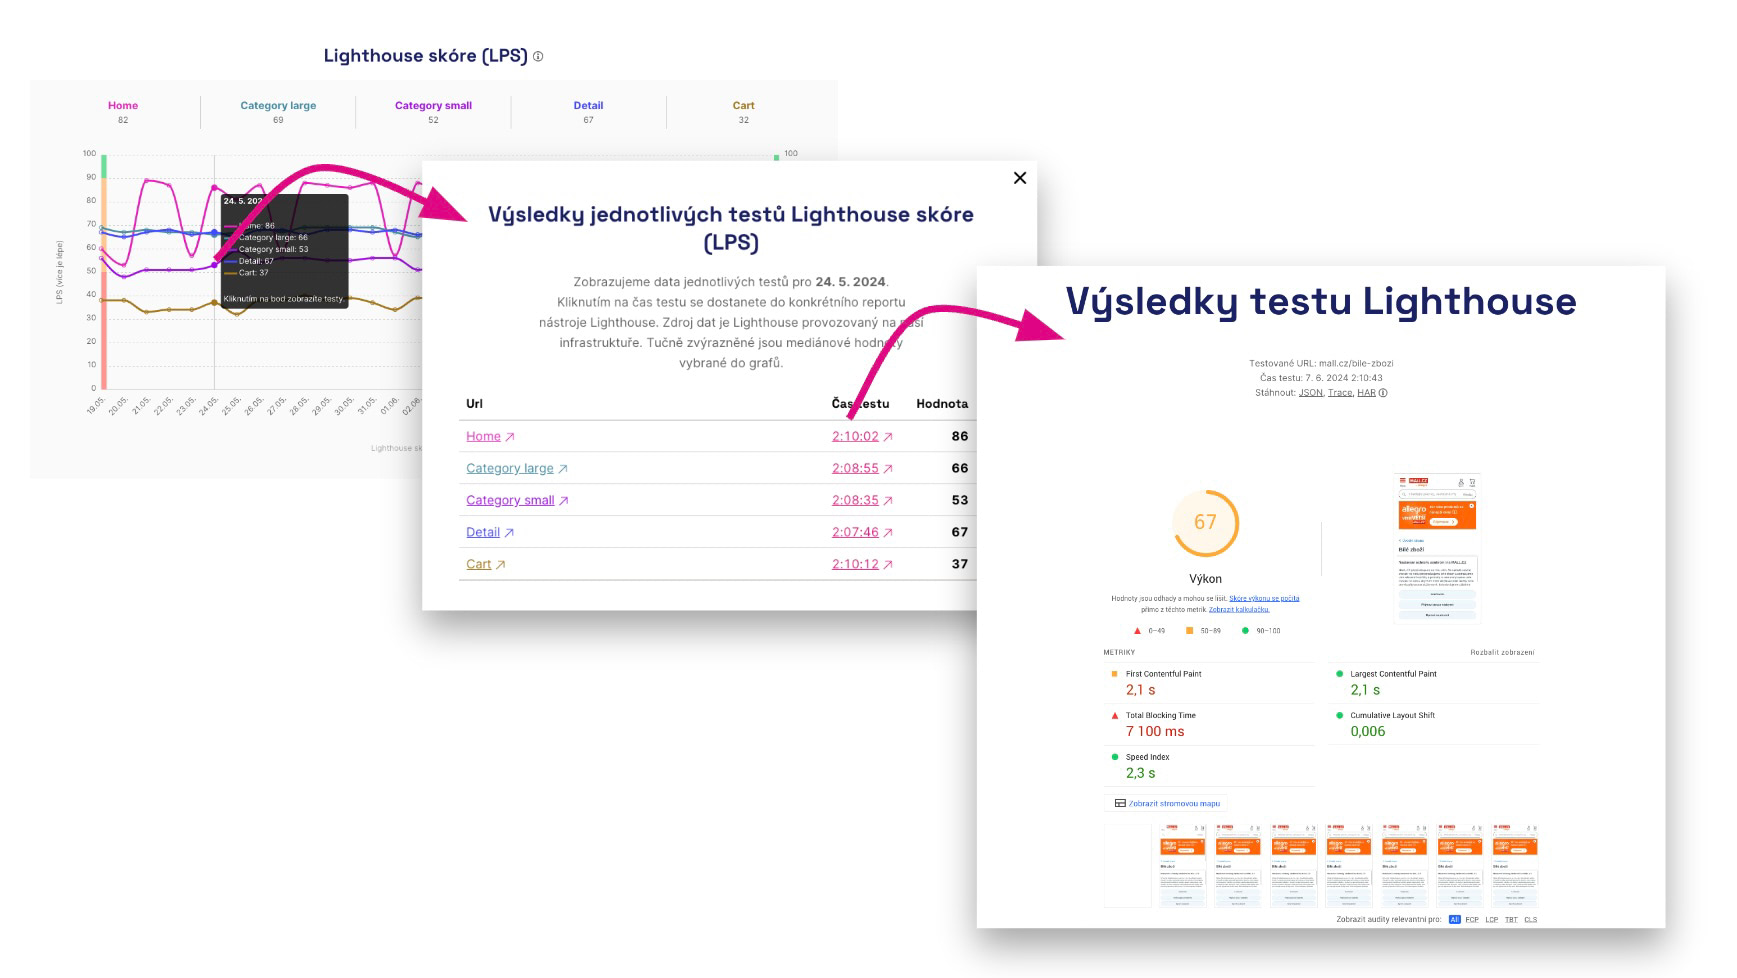 How to access the Lighthouse test run detail.
What you’ll see in the Test Run Detail?
Let’s break down the sections you’ll see on screen and how they help you:
1) Metric status for this test run
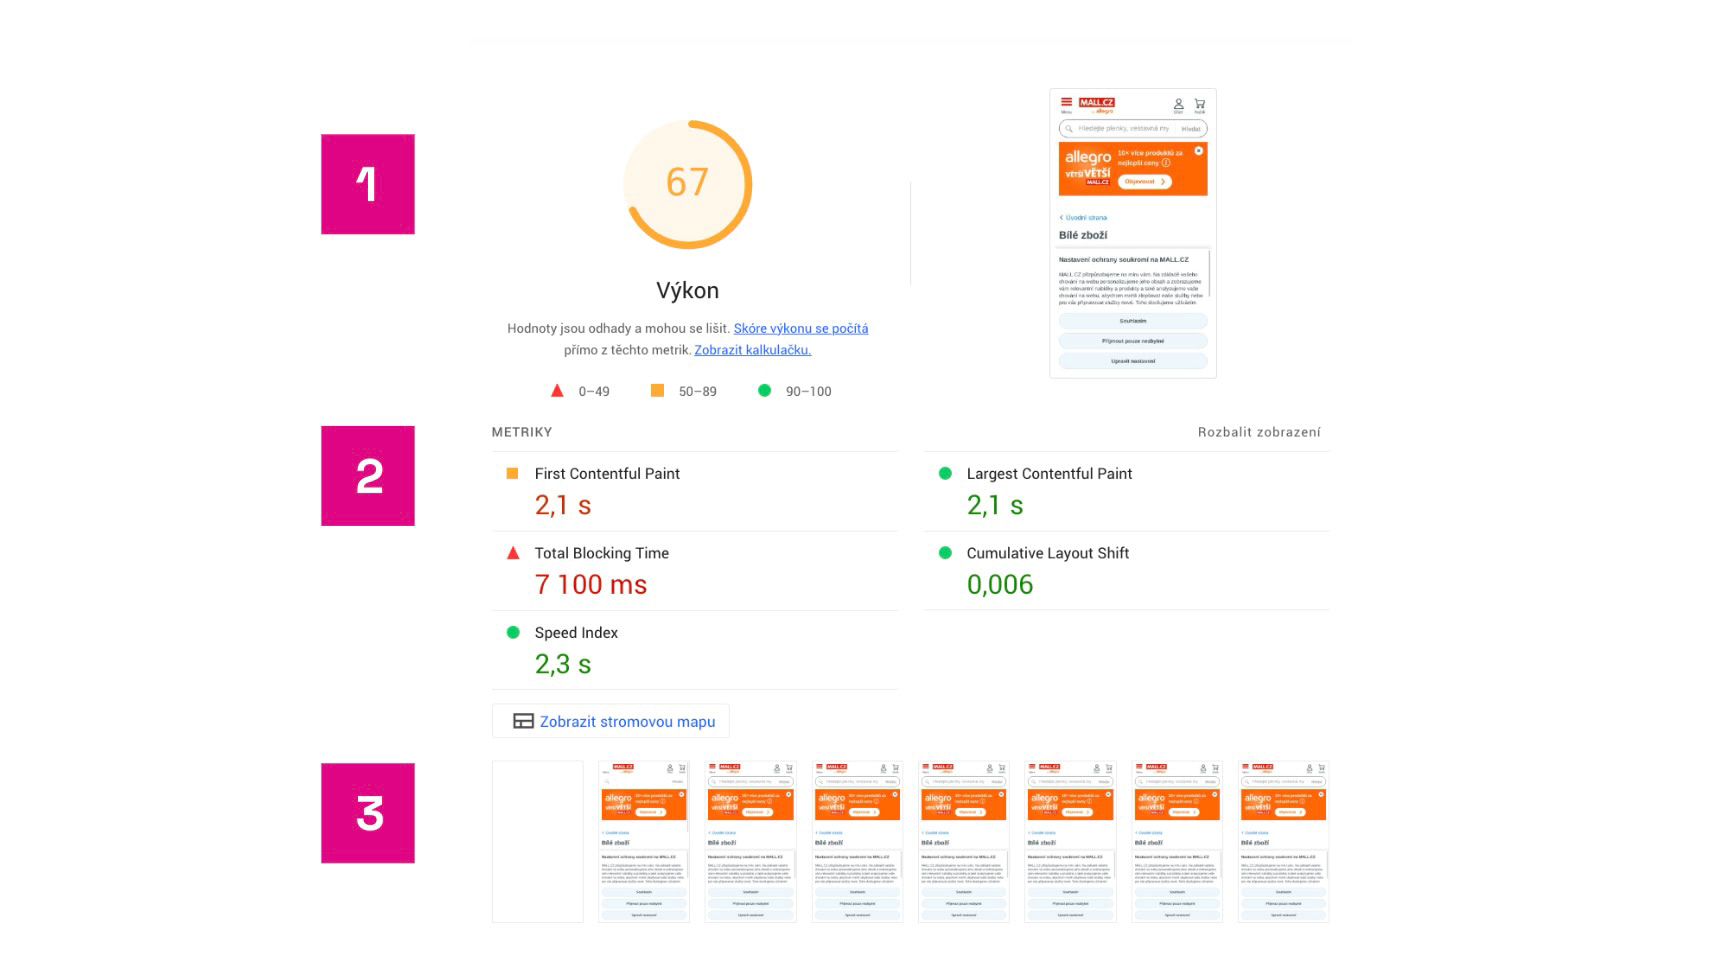 Lighthouse results and metrics.
Here you’ll see:
- Lighthouse score — the overall score derived from the metrics.
- The status of individual metrics. In addition to Core Web Vitals (LCP, CLS, TBT — note they’re measured differently than in CrUX data), you’ll also see FCP and Speed Index.
- How the page rendered during the Lighthouse test.
Note: Don’t rely too heavily on these metric values. They aren’t used to judge your site’s speed (CrUX data applies). Use synthetic data as a baseline for speed optimization. They’ll clearly show whether your optimizations are working.
2) Downloadable files
At the top of the test run results you can download JSON, Trace, and HAR files. What are they for?
🔒 Downloadable files are available only with Monitoring Plus.
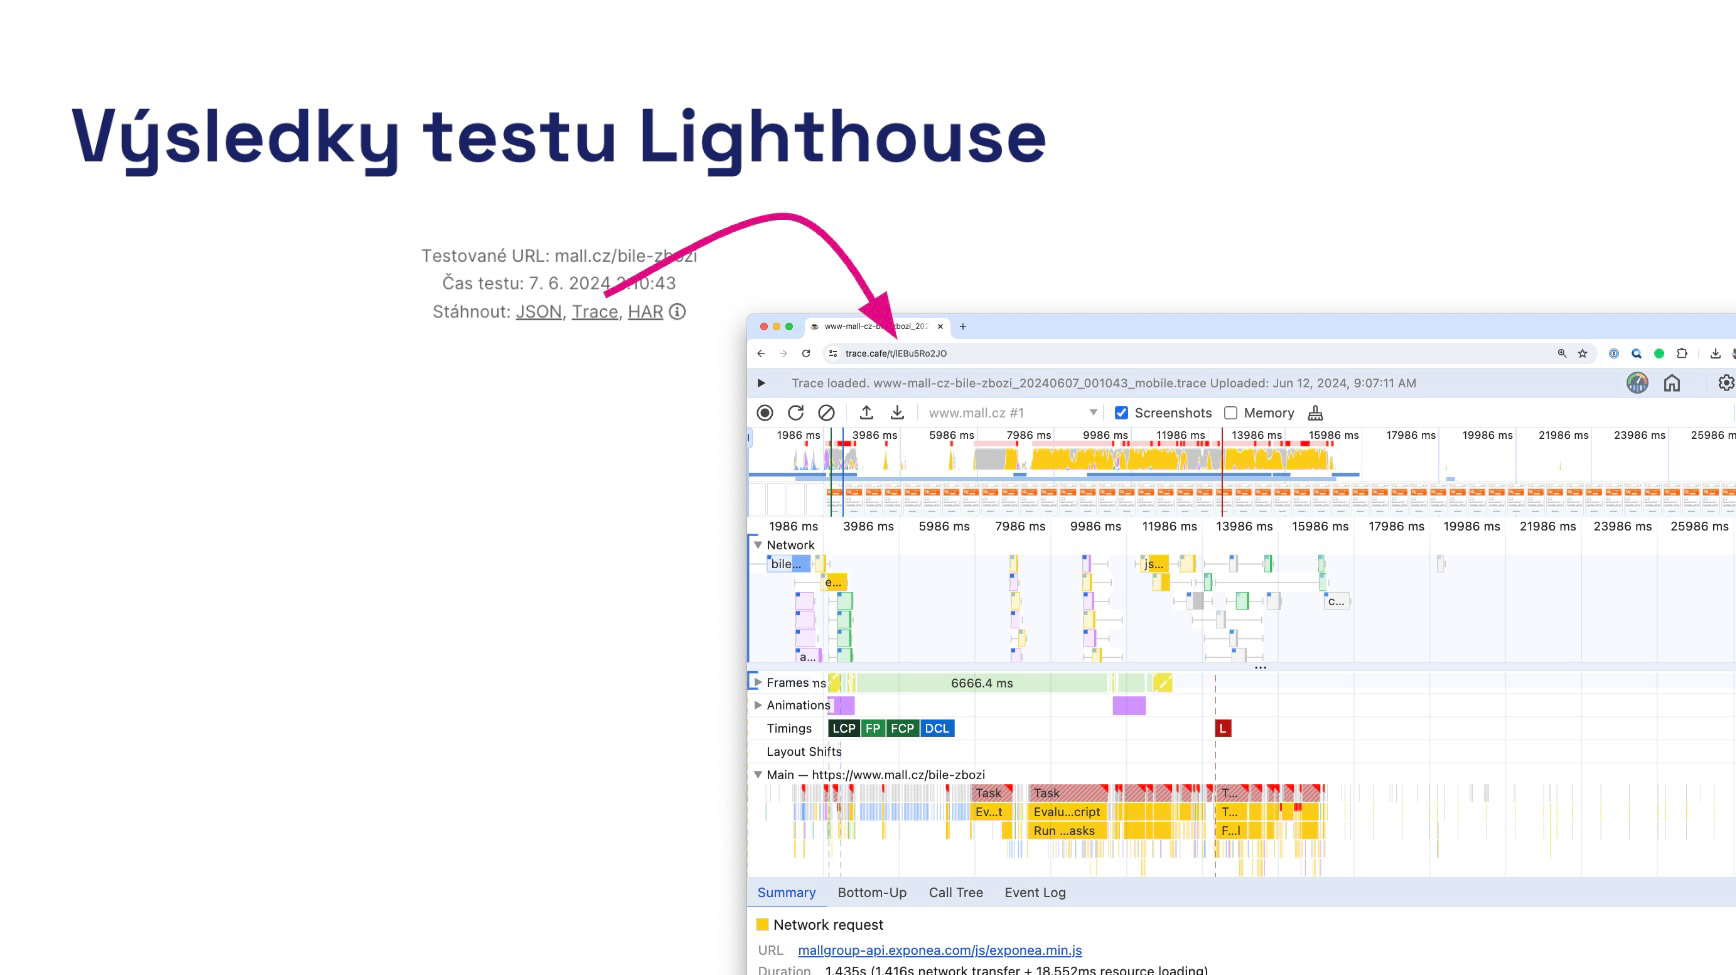 Opening the page load detail in Trace.cafe.
What are JSON, Trace, and HAR about?
All three files are valuable aids for any speed optimizer when tracing changes or opportunities to improve.
JSON: Portable Lighthouse report
Open it in the Lighthouse Report Viewer or compare it with another test in Lighthouse Diff.
JSON is handy for comparing two speed tests when things change. Or use it to archive tests that show unexpectedly good or bad results.
Trace: Detailed page performance report
Trace in our web speed consulting is the most essential view of real load speed and subsequent performance.
The Trace file can be opened in the Performance tab in Chrome DevTools or in Trace.Café.
Michal Matuška discusses the Performance tab and other Chrome DevTools tools in this video from Vzhůru dolů.
HAR: Page load report
HAR is an additional report that details issues in the page load, including element prioritization, resources loaded, the protocol used, and compression.
Open it in the Network tab inside Chrome DevTools.
3) Optimization recommendations
In addition to metric values, Lighthouse recommendations are useful for optimizing your site. Some important recommendations may not apply to your tech stack, and Lighthouse will not account for the effectiveness of recommendations in your environment. Some recommendations are hard to implement within a reasonable time or won’t have a big impact.
TIP: Looking to boost speed? Consider our advisory services.
Lighthouse tool error messages
You may see various error messages in the test; here’s what they mean:
Timeout exceeded
The most common issue is not completing the full test cycle due to a timeout on our infrastructure. It may show as NO_TTI_CPU_IDLE_PERIOD or PROTOCOL_TIMEOUT.
In our experience, however, some of the five tests usually pass, which is why we run five tests. If not, please contact us.
Page failed to load at all
Other errors include:
- ERRORED_DOCUMENT_REQUEST — the requested page could not be reliably loaded.
- NO_FCP — the page didn’t render any content; no FCP metric.
- NOT_HTML — the page isn’t HTML; delivered with MIME type text/plain.
If so, ensure the page exists and isn’t blocked to crawlers or behind a login or VPN.
Summary and next steps
The Test Run Detail provides truly granular data from Lighthouse synthetic tests. For developers, it’s especially useful to learn how to work with this page.
Visit Vzhůru dolů for a tutorial on speeding up your site with Pagespeed.cz and the test run detail.