How we measure website speed?
In this article you’ll learn exactly how we collect and process speed data for websites in the app.pagespeed.cz monitoring.
Before you dive in, make sure you understand the differences between the various speed measurement types (CrUX, synth, and RUM) and that you know the basics of our speed monitoring.
Google user data
Core Web Vitals metrics (LCP, INP, CLS) from the Chrome UX Report (CrUX) are collected to display in our reports as follows:
- In PLUS tests we download them and add to reports every night. This covers data for both the Pages report, the Domains report, and all CrUX data across the app. It applies to both mobile and desktop.
- In free tests we do not download page data at all. Domain data is downloaded every two days, alternating between mobile and desktop.
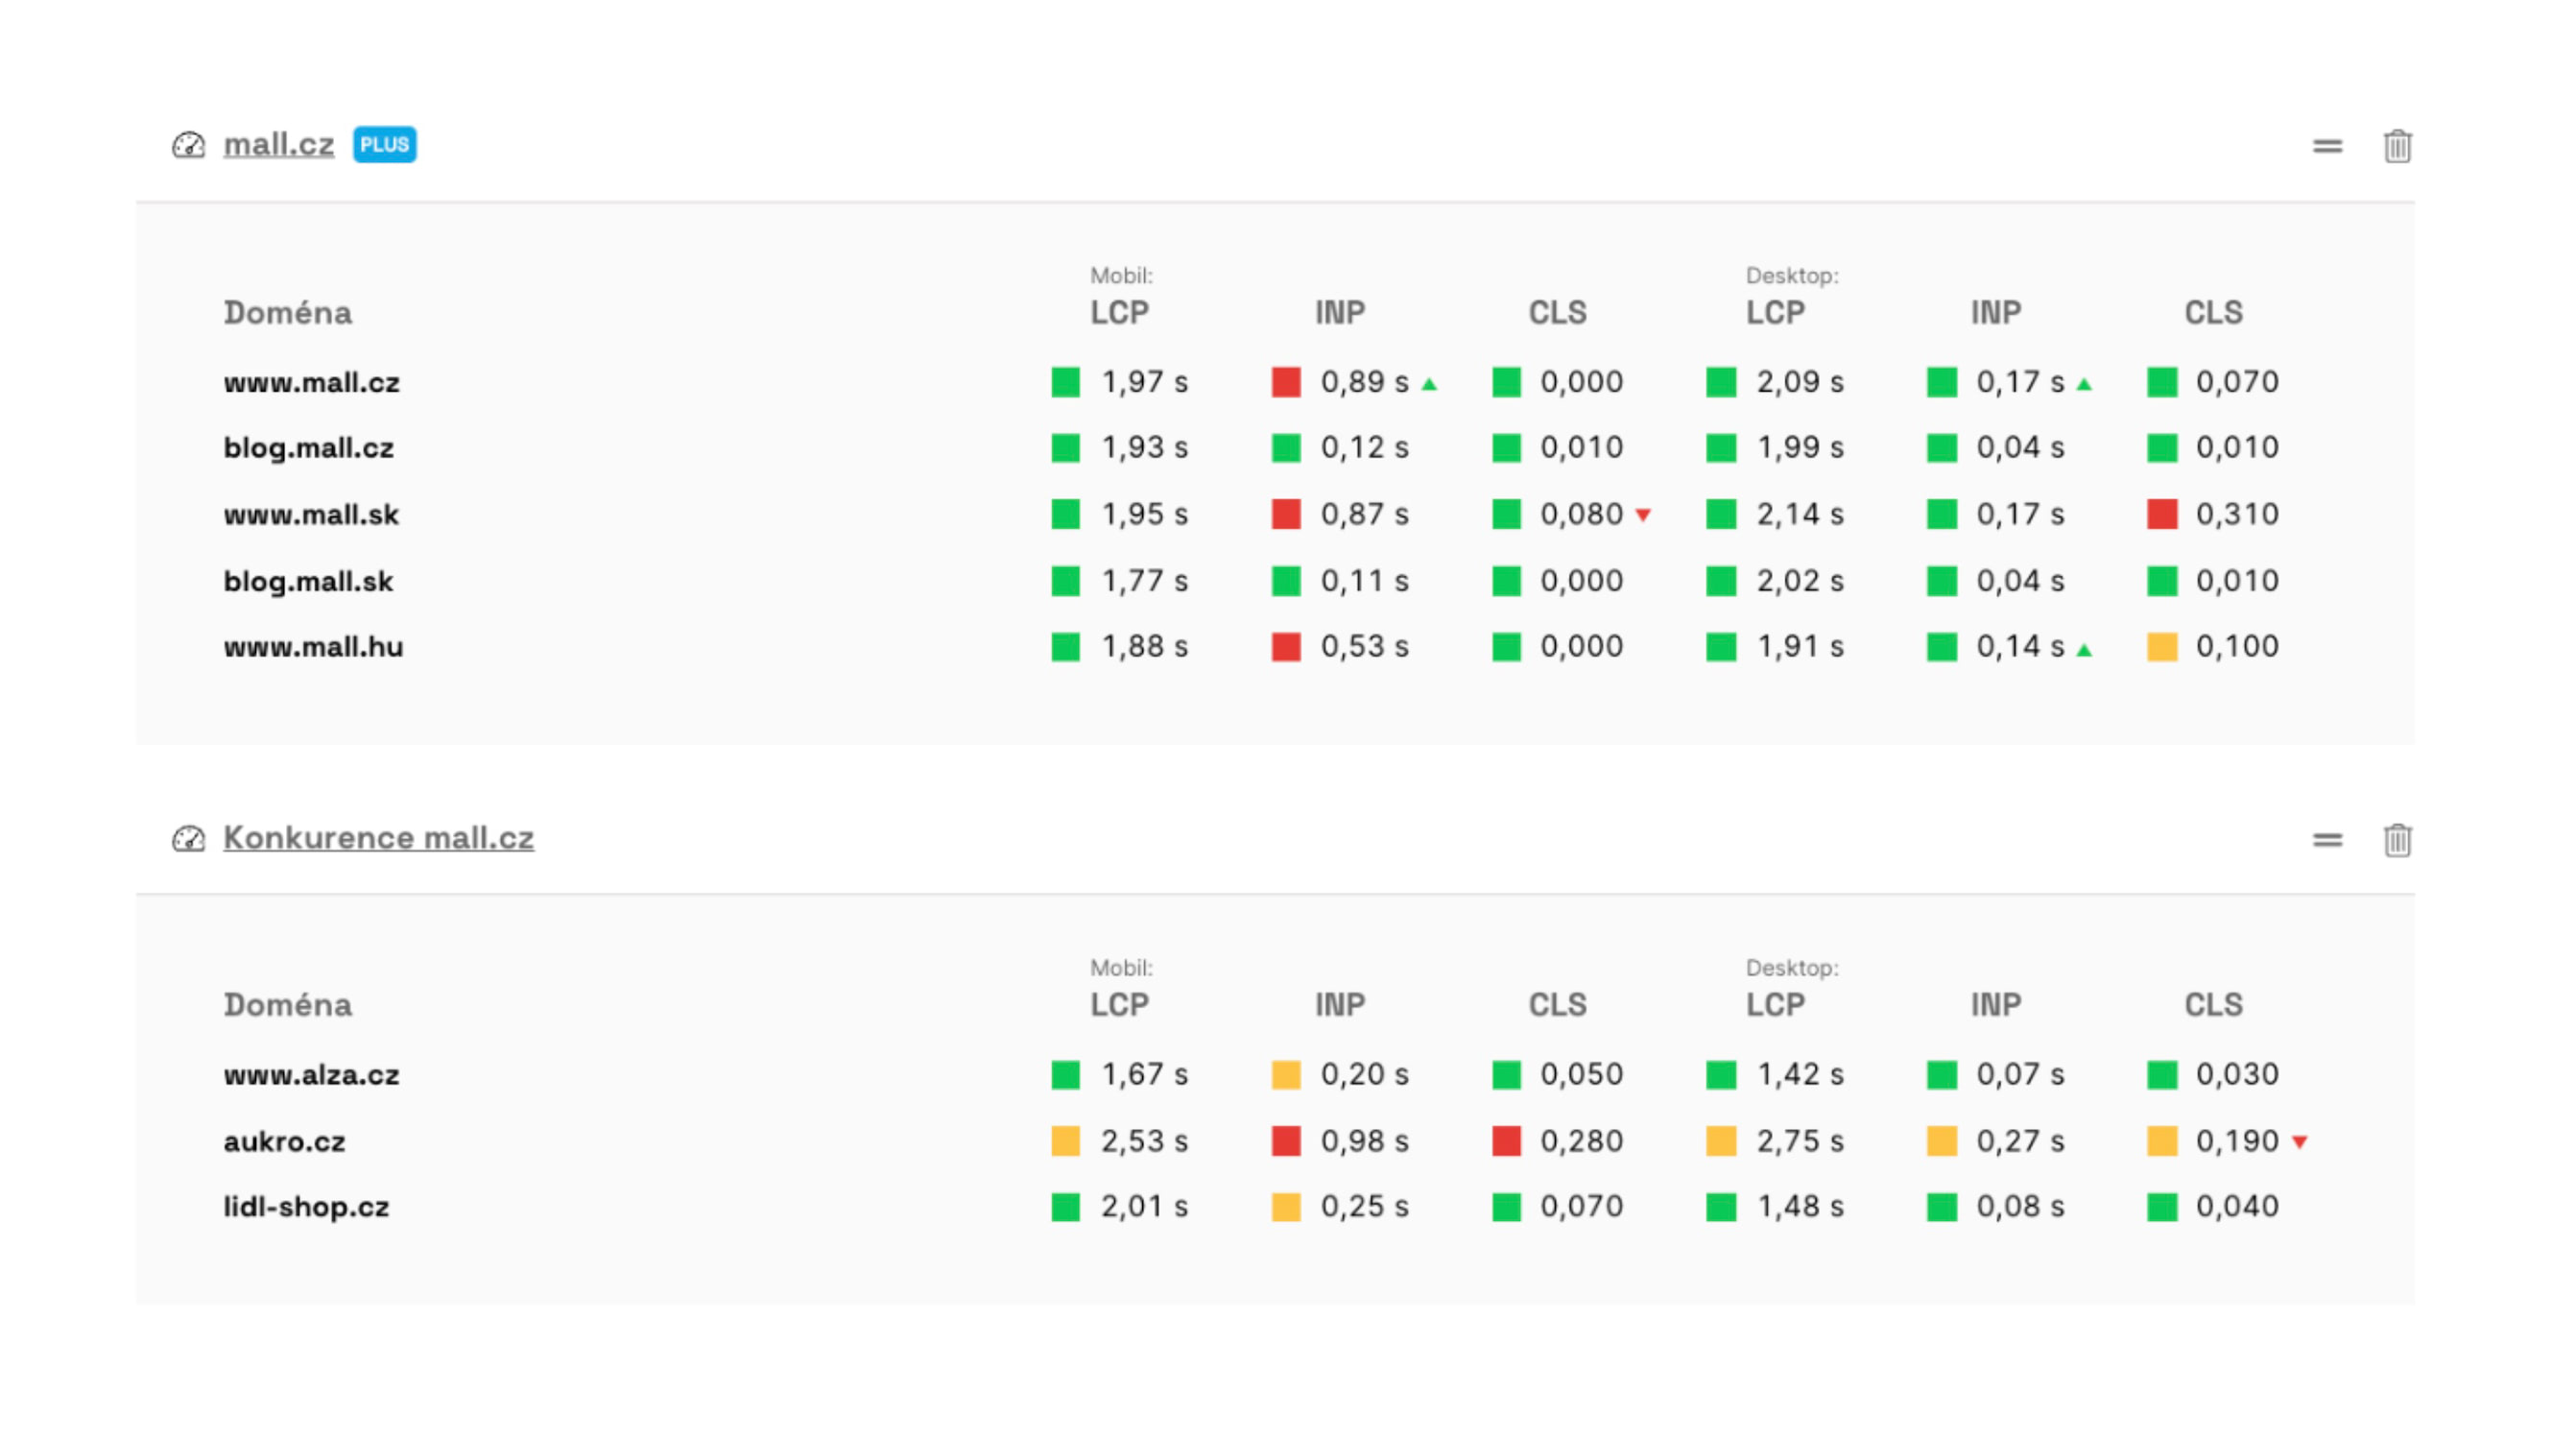 Data from the Chrome UX Report can be seen, for example, on your team’s main dashboard.
Data for monthly metric trend graphs (in the Domains report) is downloaded once a month. The data is released on the second Wednesday of the month, and we process it over the following days.
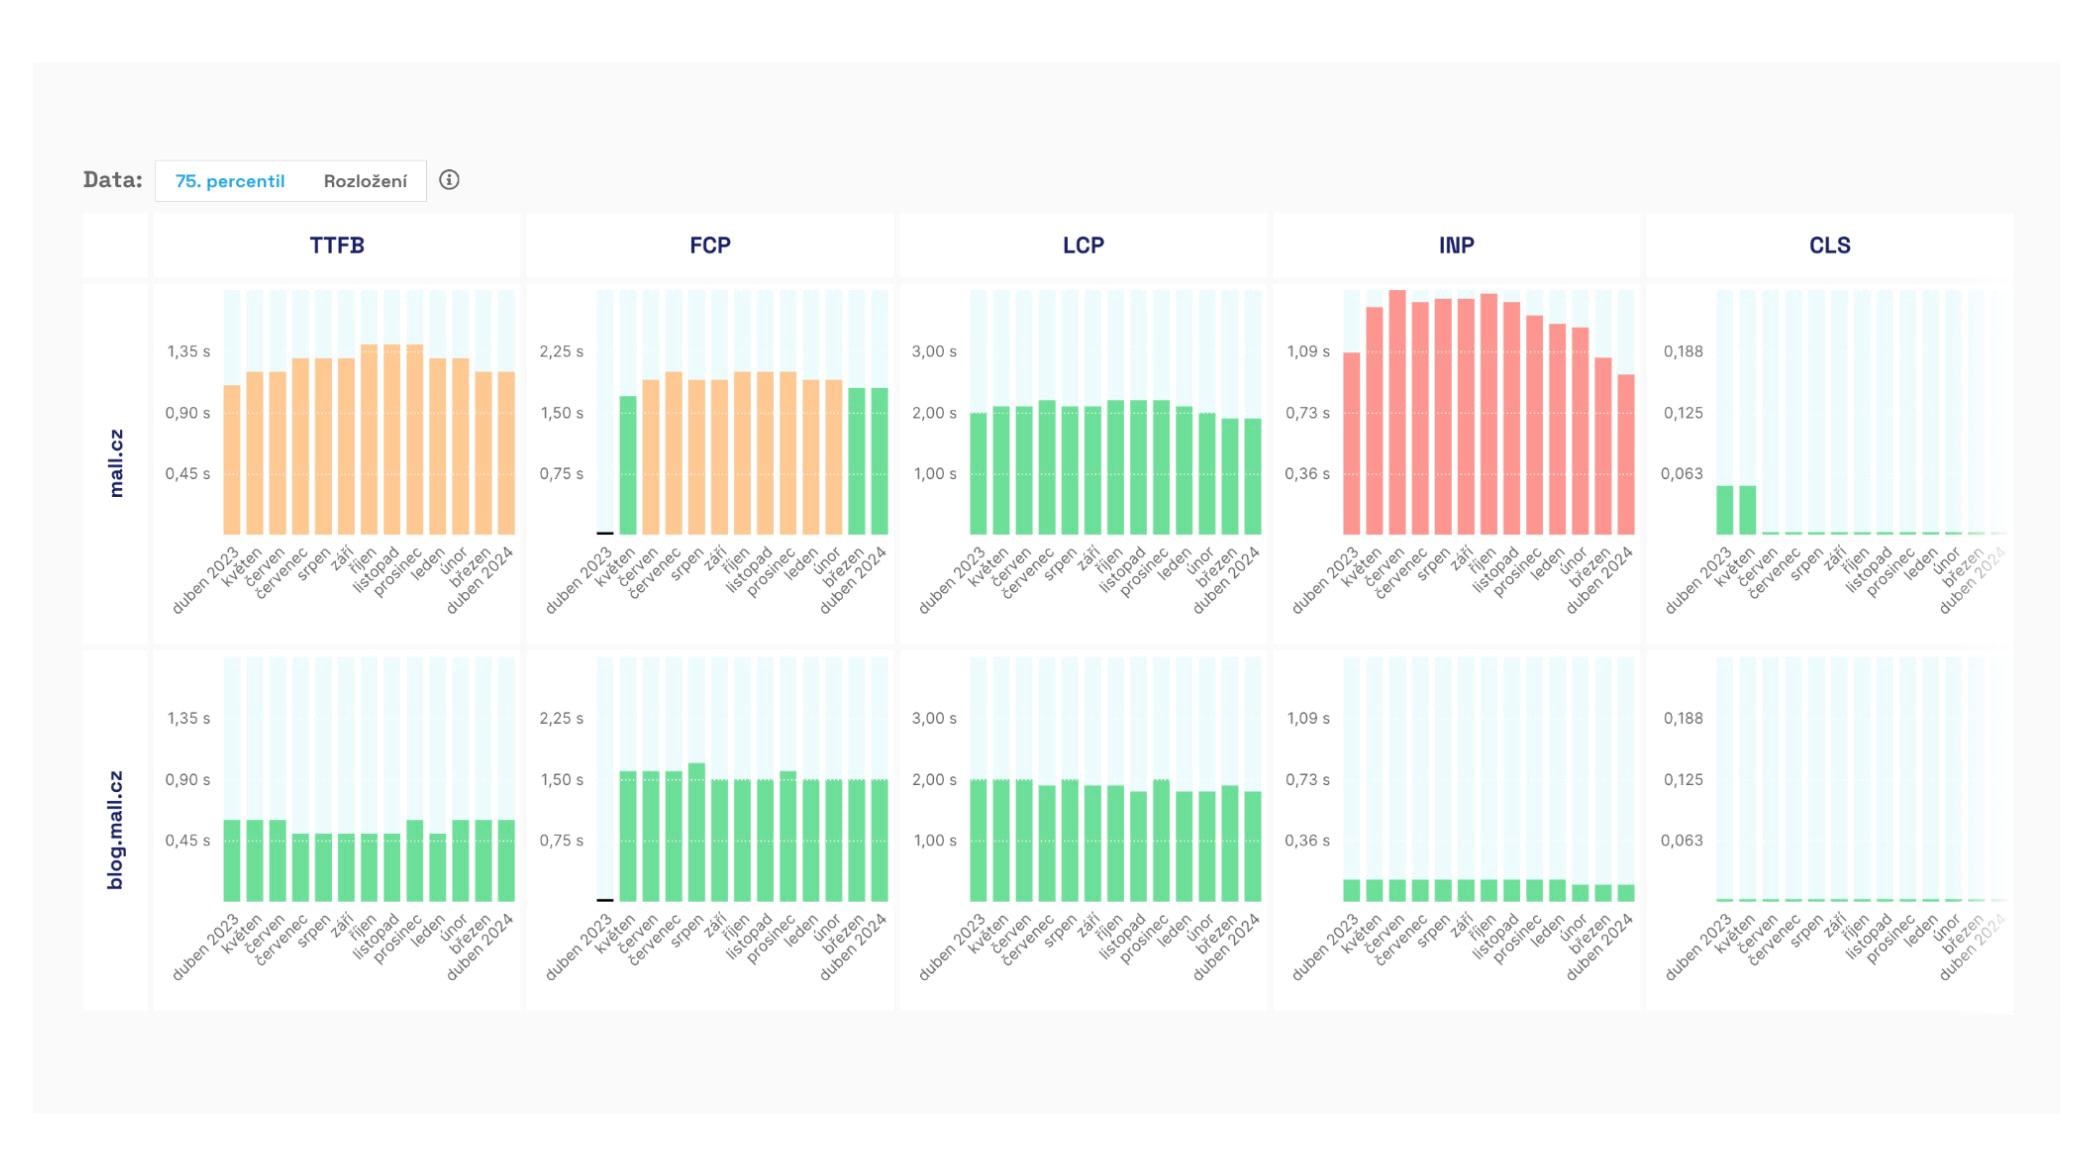 Trend of Chrome UX Report metrics by month, shown in the Domains report.
Synthetic data
Data from Lighthouse synthetic tests is obtained in two ways:
- In PLUS tests we run Lighthouse on our own infrastructure multiple times a day. We’ll elaborate below.
- In free tests we fetch less precise data from the PageSpeed Insights API once every two days for both desktop and mobile.
Now, let’s look at how we run synthetic measurements in PLUS tests.
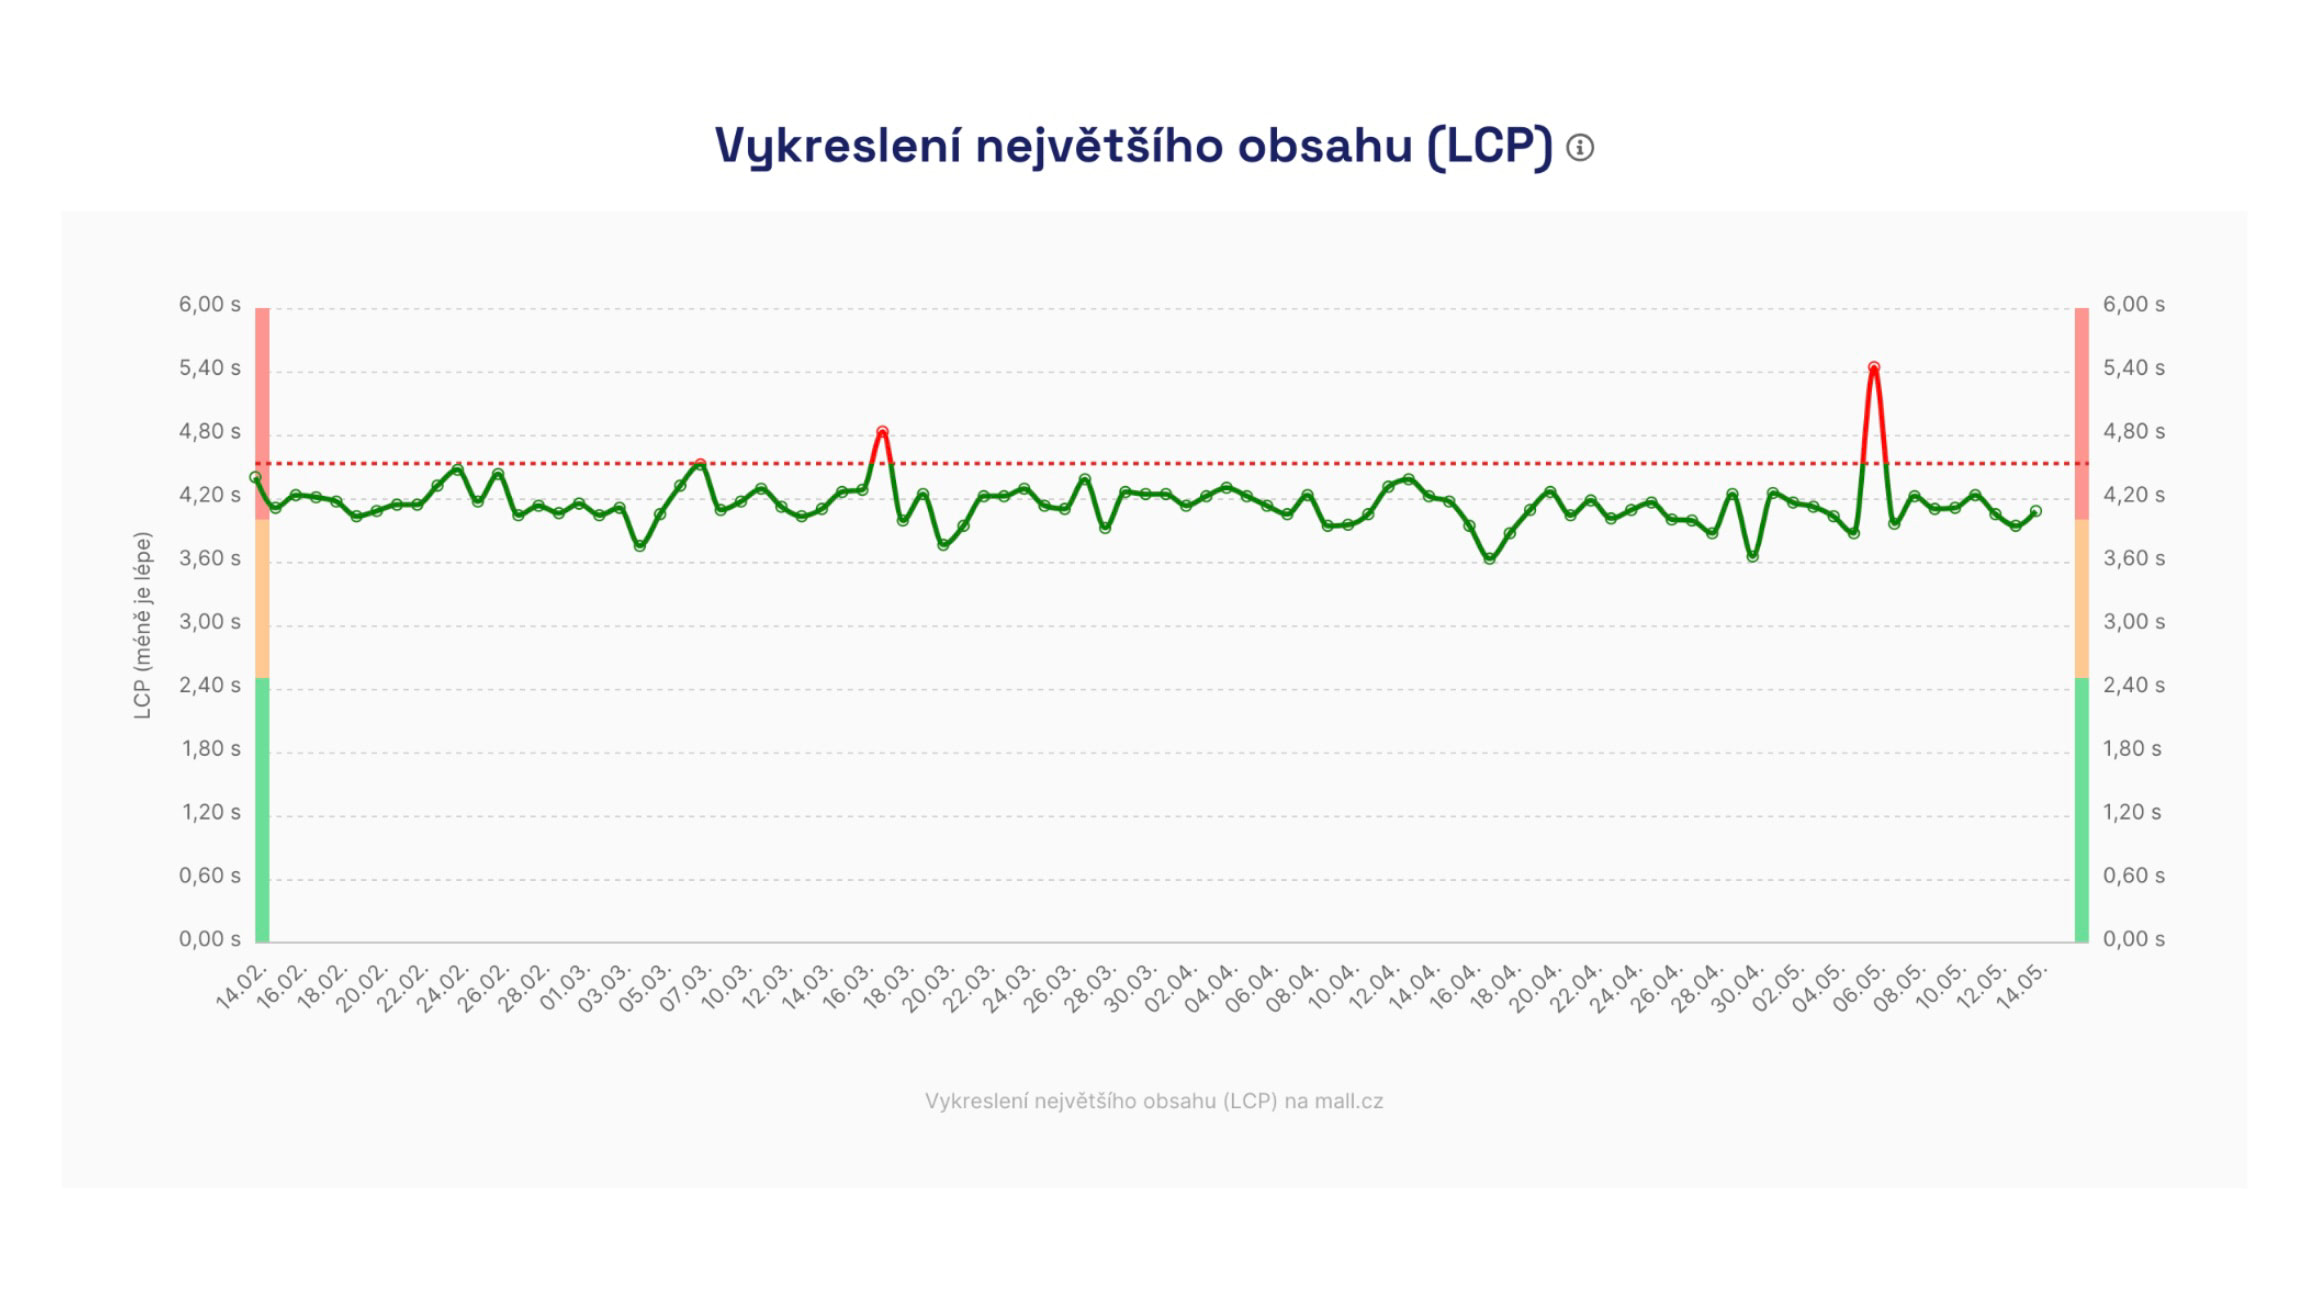 Synthetic data supports daily data collection, for example for the Speed Watchdog.
Synthetic measurements in PLUS tests
🔒 We conduct this type of measurement in PLUS tests.
Based on our experience with other tools during web performance consulting and numerous experiments during the development of the monitoring, we settled on the following approach for testing each URL.
We test at night, five short runs in a row, and run the whole thing once a day.
Night hours
For short-term (days) and longer-term (months) data collection of Core Web Vitals metrics we consider night hours best practice.
At night your servers aren’t under heavy load, so we can test more calmly and observe long-term trends in speed. Server response time (TTFB) affects user metrics such as LCP and FCP.
We’ve found night-time results are much more stable and reveal more about metric trends over time.
:::tip If night hours don’t work for you, for example due to ongoing site maintenance, you can change the test time in [test settings]. :::
Five short runs in a row
We know that single tests, such as those run with PageSpeed Insights in our free tests, can yield inaccurate results.
Through experimentation we determined that performing five tests reduces the most inaccuracies and yields the most stable numbers. The tests run several minutes apart; you can see the exact times in the Lighthouse test details.
Once daily
Each URL is tested in a few minutes, and we run these tests once daily, always at night.
Why test so “little”?
Sometimes people ask why testing happens only within a short daytime window. Why not test synthetically every minute?
It’s important to note that our monitoring focuses on user-centric metrics like Core Web Vitals. It isn’t about server availability or load monitoring—that’s handled by other tools like Uptimerobot.com or Updown.io.
Synthetic measurements should not replace user data, which provides precise performance information across different times and user segments.
To track changes by users, we collect data from the Chrome UX Report, and for larger sites we deploy SpeedCurve RUM.
What exactly do we test and how is the measurement configured?
Tests run on European AWS infrastructure, currently from Frankfurt, Germany.
We carefully select test machines to minimize variance, especially for JavaScript metrics like Total Blocking Time (TBT).
Even so, occasional fluctuations can occur due to measurement infrastructure. In such cases we inform you and add automatic notes to the charts.
And how is the measurement configured? Since October 2024 the slowdown of both measurements is as follows:
| Device | Download | Upload | RTT (round-trip time) |
|---|---|---|---|
| Mobile | 1.6 Mbps | 0.75 Mbps | 100 ms |
| Desktop | 10 Mbps | 10 Mbps | 40 ms |
How to allow our bot on your site?
If you want to test a work-in-progress version of your site or a preview (e.g., beta, test, staging, pre-production) that’s protected behind some access.
Sometimes speed testing fails even on production sites. Our test bot can get blocked by robots on your infrastructure.
You can whitelist our bot in one of two ways:
- Detect our bot’s user-agent string. Our bot includes words like “Pagespeed.cz” or “Chrome-Lighthouse.”
- Detect the IP address. Our bot comes from 18.192.177.19.
If your infrastructure uses a Web Application Firewall (WAF), you’ll need to add a rule that bypasses blocks when accessed from our IP address, see above. This can occur with providers like Cloudflare, Azure, or others.
How to measure websites with HTTP authentication?
HTTP authentication (often in the form of HTTP Basic Auth) is a simple way to protect a site, requiring a username and password as soon as the page loads.
It’s mainly used for staging or development versions, and you can use it for synthetic testing in the PLUS monitoring as well.
Note: sites behind a password are typically slower. Using HTTP auth can show tens of percent worse TTFB, FCP, and LCP metrics. We’ll explain why.
How to configure HTTP Basic Auth for measurements?
Our tests handle HTTP authentication—just enter the URL with credentials in the tester. Access uses standard Basic Auth, just as in a regular browser.
In test settings add URLs with credentials:
https://username:password@example.com/url
Impact on measurement results
Websites running in staging environments often have unstable server responses. They typically run without cache, without a CDN, sometimes in debug mode. Result: slower across all speed metrics (TTFB, FCP, LCP).
HTTP authentication itself adds about 450–500 ms of delay, further affecting loading speed metrics.
You can see the impact of HTTP authentication in HAR files or Tracy in the [test run details] on the stages Stalled or Request Sent.
How to measure more accurately on a staging server?
If you need to measure staging or non-public versions without distortion:
- Use an IP-based backdoor or the User-Agent string, as described above
- Set an exception for [our bot], see above
This yields cleaner data that isn’t skewed by HTTP authentication.
Try our Speed Monitoring PLUS.