How to Evaluate Watchdog Alerts?
Watchdog monitors the speed of the measured pages on your site daily in Monitoring PLUS. If any key metric changes, Watchdog will alert you. This guide explains who should evaluate these alerts and how.
 Watchdog speed alert received. What next?
We’ve fine-tuned Watchdog based on our advisory work for clients and our own use, but evaluating its alerts still requires some know-how.
For example, due to the nature of synthetic measurements, Watchdog can send a notification even when there isn’t a major issue on the site.
With the knowledge from this guide, you’ll be able to handle Watchdog alerts.
How Watchdog Works
In short, Watchdog operates as follows:
- Watchdog collects data from synthetic measurements. (See the difference between measurement types.)
- Every day, Watchdog tests all URLs configured in the test settings.
- For each speed metric, it derives a single site-wide value.
- Each metric has its own acceptable change limits.
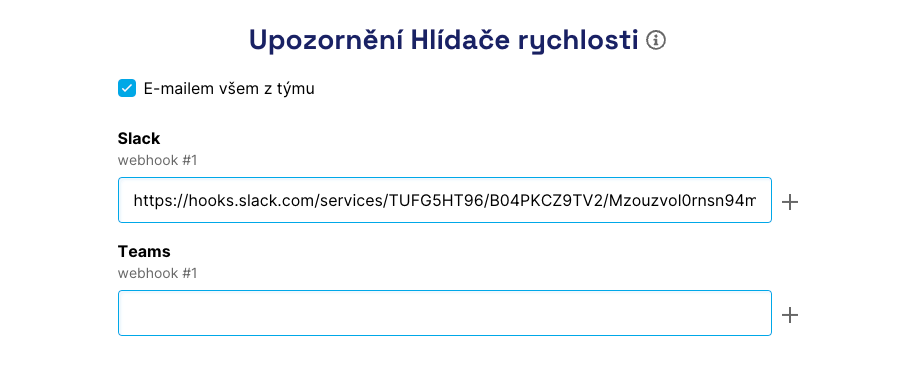
- If a limit is exceeded, you’ll receive a notification by email or Slack/Teams.
More about how Watchdog works.
Alerts are Mainly for Developers
We recommend monitoring Watchdog primarily by developers and others who focus on web speed daily. It requires technical knowledge and time.
For managers, marketers, UX specialists, and similar roles, Monitoring PLUS offers other reports, e.g., a monthly email speed status report or a team dashboard.
Managers may want to disable Watchdog alerts:
 You can disable Watchdog alerts in Email Settings if colleagues already monitor changes.
How to Generally Evaluate Alerts?
If you’ve received an email or a Slack/Teams alert, your first questions should be:
- Does the change also affect user metrics, i.e., CrUX data?
- Were there code deployments on the site during the days of the metric change (and are they noted in the notes)?
- Which specific page types are affected?
- Can the change be seen in the test run detail?
TIP: In Vzhůru dolů you’ll find a detailed tutorial describing Monitoring PLUS and Watchdog using a real-world issue.
Does the Change Affect User Metrics?
Seasoned users know not all metrics are created equal. Watchdog collects data from synthetic measurements, but we care about their impact on user data.
User data (CrUX) isn’t yet available on a daily basis, as it lags by several weeks.
Let’s evaluate the change in Watchdog. Open the Domains report, where you can see data from the Chrome UX Report (CrUX). Do you see the same issue there? A few notes:
- CrUX data are computed cumulatively over roughly the last 28 days, so domain data may show only a small change, but that can still be meaningful.
- Changes in user data may appear up to three days after the real web change.
- Not all user metrics can be measured synthetically. See the metric-specific guidance below. For example, the synthetic TTFB metric may (or may not) influence interaction speed, INP.
Remember that CrUX data are computed cumulatively over the last 28 days and may have several days of lag.
Proceed with evaluation only if you see changes in both Watchdog and user data.
 Watchdog metrics can move wildly, but CrUX data may not reflect that. In that case, don’t panic—focus on long-term trends. See also the [Domains report].(/docs/report-domains)
Is This Not a Cyclical Issue?
Another common pattern is seasonality—the cyclical recurrence of certain problems. How to spot it?
In the Watchdog report, look at the long-term trend (at least 3 months). Some metrics (like TBT) tend to wax and wane cyclically.
Seasonal traffic can also play a role, often showing up in server response times (TTFB).
How to Evaluate Individual Metrics?
The following sections provide guidance for specific metrics. They may look similar, but pay attention to each metric.
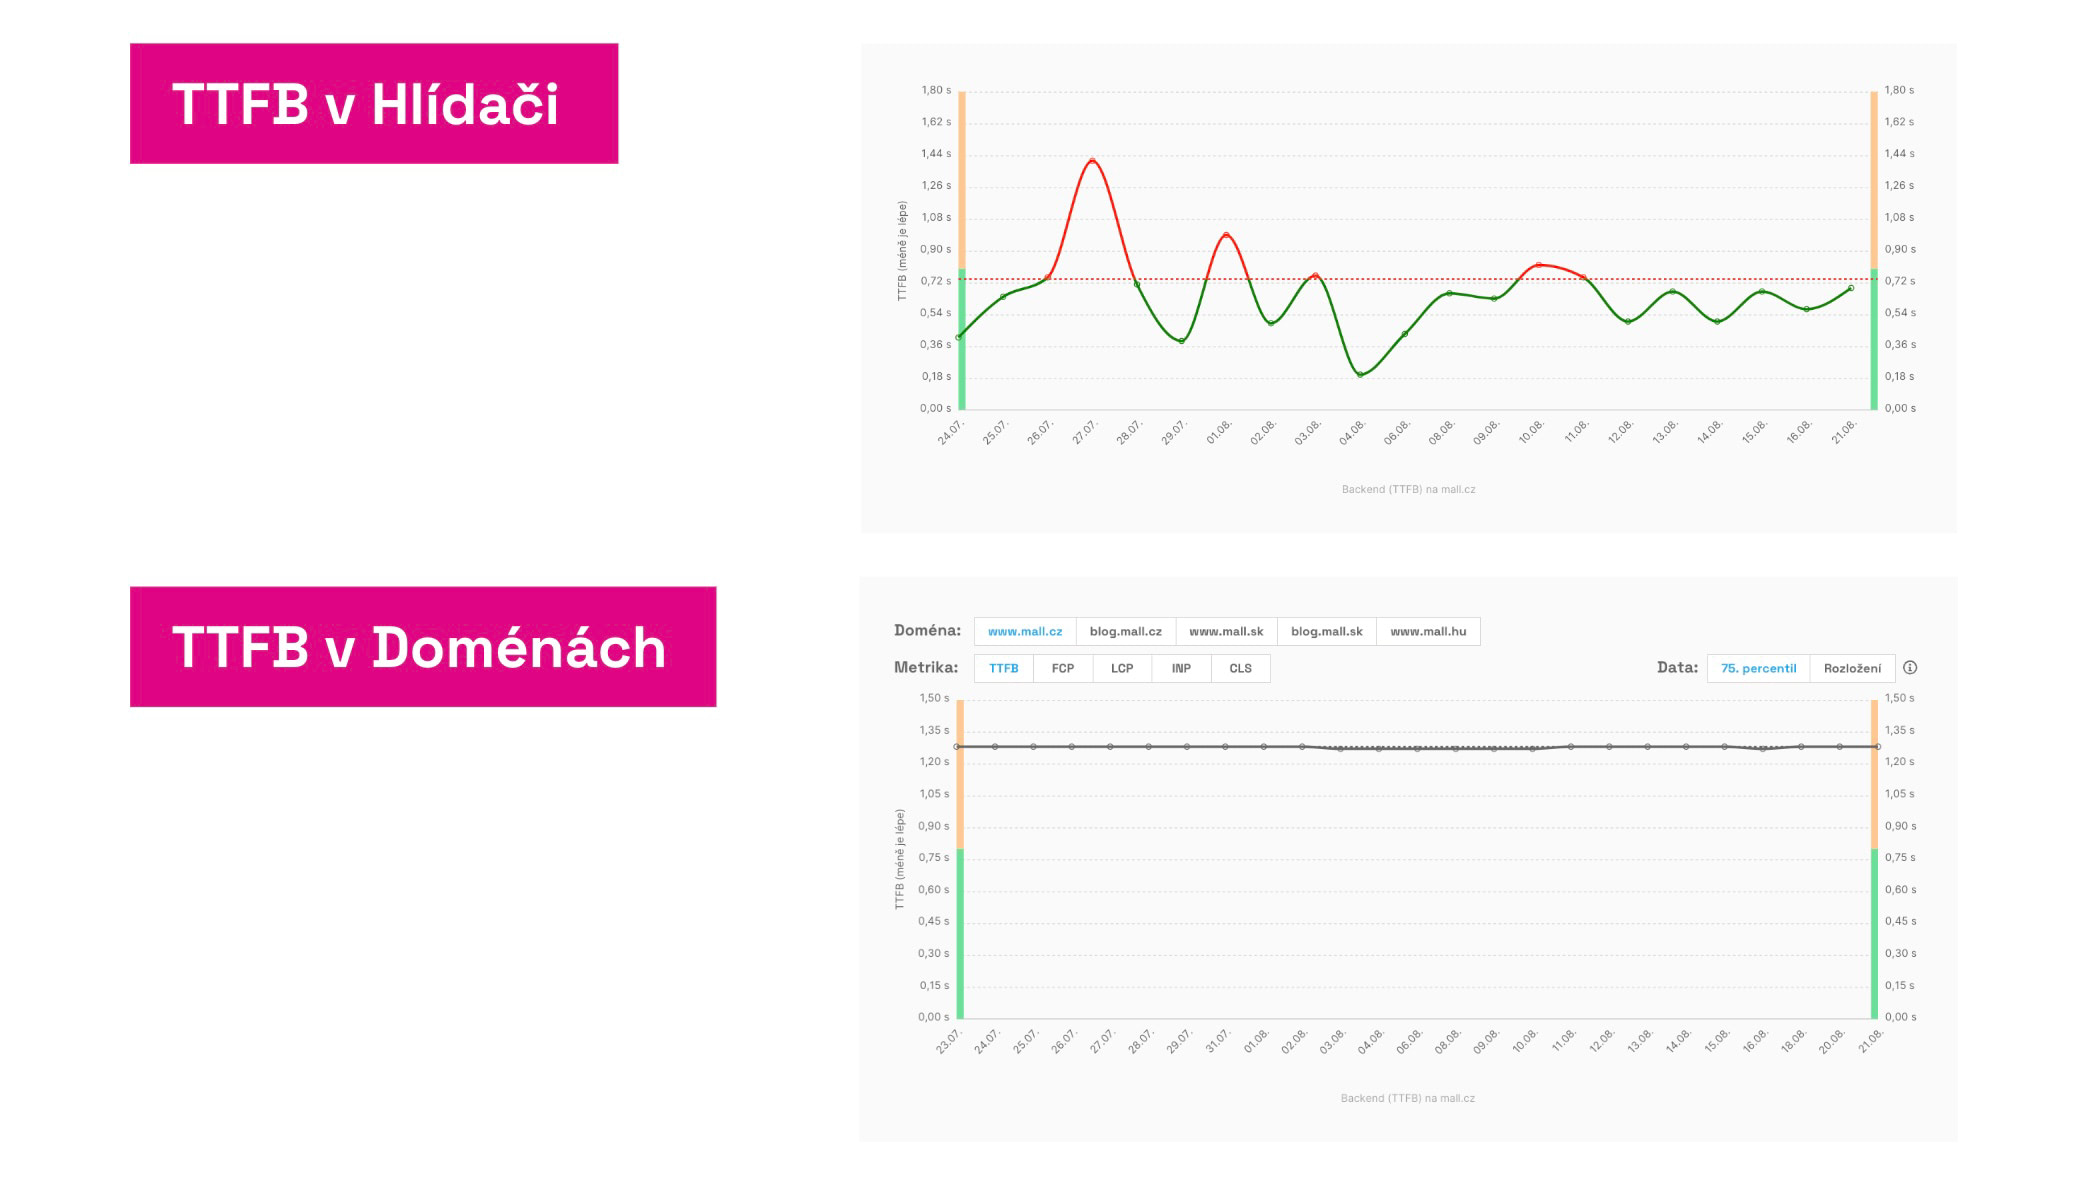
Backend (TTFB)
Time To First Byte (TTFB) measures server response time, but the metric also reflects your server infrastructure and user connection speed.
TTFB is a critical metric; a deterioration will directly affect Core Web Vitals, especially LCP. Because of [crawl budget], TTFB also influences SEO.
How to evaluate a TTFB alert?
- Does it affect user metrics too? Compare the Watchdog trend with the user TTFB data in the Domains report > “Distribution of metric.” See the “How user metrics evolve” section above.
- Were there deployments during the change days? Use graph notes to mark important deployments.
- Which page types are affected? See the Pages report for TTFB trends across page types. Both synthetic and CrUX data will show whether the issue is site-wide or part-specific.
- Could your server infrastructure be temporarily stressed? Seasonal campaigns or peak times can cause temporary latency. The key is to avoid long-term (>0.8 s in CrUX) degradation.
- Is there a persistent TTFB deterioration? Monitor hosting provider memory and CPU usage. Hardware upgrades are often undervalued and may help.
- Can you see the change in the test run detail? Click the synthetic results chart to open the test run detail with Lighthouse data. Compare with the previous day. Lighthouse may reveal root causes and optimization opportunities. Developers can also measure Web Vitals directly in the browser and open the test run detail outputs there.
Focus on TTFB optimization as an ongoing effort, not just a reaction to problems.
Read our more detailed article on how backend developers can help with speed: backend optimization.
First Contentful Paint (FCP)
The First Contentful Paint (FCP) metric shows the time to render the first content on your site.
This is an important supporting metric; changes often affect loading speed (LCP) and various user metrics such as bounce rate.
How to evaluate an FCP alert?
- Does it affect user metrics too? Compare the Watchdog trend with the user FCP data in the Domains report > “Distribution of metric.” See the “How user metrics evolve” section above.
- Were there deployments during the change days? Use notes in graphs to mark important deployments.
- Which page types are affected? See the Pages report for FCP trends by page type. Both synthetic and CrUX data will show whether the issue is site-wide or part-specific.
- Is the core issue measurable by another metric? Did the core server response also change, i.e., [TTFB]? Backend speed can directly affect FCP and LCP, so the culprit is often here.
- Is the issue in critical resources and visible in technical indicators? If FCP changed but TTFB did not, the problem may lie with FCP itself. Look for changes in critical resource data (e.g., HTML, CSS, large JS files, fonts, images) in the Technical report and metrics like Data volume of JS, Fonts, or [Images data volume].
- Can you see the change in the test run detail? Open the synthetic results chart to view the test run detail with Lighthouse data. Compare with the previous day. Lighthouse can highlight the root causes and optimization opportunities. Developers can also measure Web Vitals directly in the browser.
Continue working on FCP optimization proactively, not just when problems arise.
Largest Contentful Paint (LCP)
Largest Contentful Paint (LCP) shows the time to render the main content on a page.
LCP is one of the three Core Web Vitals and a key indicator often correlating with conversion on e-commerce sites.
How to evaluate an LCP alert?
- Does it affect user metrics too? Compare the Watchdog trend with user LCP data in the Domains report > “Distribution of metric.” See the “How user metrics evolve” section above.
- Were there deployments during the change days? Utilize notes in graphs to mark important deployments.
- Which page types are affected? Check the Pages report for LCP trends by page type. Synthetic and CrUX data will show whether the issue is site-wide or part-specific.
- Is the root cause measurable by another metric? Did the server response also change, i.e., [TTFB]? Backend speed can impact FCP and LCP, so the culprit is often here. If TTFB didn’t change but FCP and LCP did, the issue is likely with FCP, possibly due to critical resource data changes.
- Are there issues with resources for LCP elements? If TTFB and FCP didn’t change, the problem may lie in the gap between FCP and LCP caused by downloading and rendering the largest elements (often asynchronous: images, JS components, web fonts). Check the Technical report and metrics like Data volume of JS, Font data, or [Images data volume].
- Can you see the change in the test run detail? Open the synthetic results chart to access the test run detail with Lighthouse data. Compare with the previous day. Lighthouse may reveal root causes and optimization opportunities. Developers can also measure Web Vitals directly in the browser and open the test run detail outputs there.
Work on LCP optimization as an ongoing effort, not only when problems arise.
Total Blocking Time (TBT)
Total Blocking Time (TBT) shows the total time JavaScript blocks the browser, potentially slowing user interactions and worsening INP.
The interaction metric (INP), a key Core Web Vitals component, can only be measured from users (CrUX data), so Watchdog cannot alert on INP changes.
TBT is synthetically measurable and may indicate possible INP deterioration, but there isn’t a direct one-to-one relationship. Deteriorated TBT can worsen INP, but INP can worsen without TBT changes. We therefore recommend tracking both Watchdog (TBT) and user data (INP).
Note that TBT is the most volatile of all metrics. In charts, values may swing widely. Watchdog reports only larger changes, and you should monitor TBT with the same approach. Take TBT with a grain of salt compared to other metrics.
How to evaluate a TBT alert?
- Does it affect user metrics too? Compare the Watchdog trend with user INP data in the Domains report > “Distribution of metric.” See How user metrics evolve above.
- Were there deployments during the change days? Use graph notes to mark important deployments.
- Which page types are affected? See the Pages report for TBT trends by page type. Synthetic and CrUX data will show whether the issue is site-wide or part-specific. The same report can show INP trends.
- What about third-party components? In the Pages report, also review the development of 3PBT, which shows the portion of TBT attributed to third-party components. If the share of blocking time by third parties is more than half, pay attention. The Test Run Detail report will indicate which third parties are problematic.
- Can you see the change in the test run detail? Open the chart with synthetic results to access the test run detail with Lighthouse data. Compare with the previous day. Lighthouse can reveal root causes and optimization opportunities. Developers can also measure Web Vitals directly in the browser and view outputs from the test run detail there.
Generally speaking, if INP is fine but TBT or 3PBT worsens significantly, these changes may not be critical.
Still, regularly focus on INP optimization, not just reactively when problems arise.
Cumulative Layout Shift (CLS)
Cumulative Layout Shift (CLS) shows the degree of unwanted layout shifts users experience during page load and interaction.
CLS is an important metric, one of the three Core Web Vitals, used by Google for SEO and PPC rankings.
How to evaluate a CLS change?
- Does it affect user metrics too? Compare the Watchdog CLS trend with user CLS data in the Domains report > “Distribution of metric.” See the “How user metrics evolve” section above.
- Were there deployments during the change days? Use graph notes to mark important deployments.
- What if CrUX and synthetic CLS data diverge? Remember that CLS from Watchdog (synthetic) can differ from CrUX CLS. Synthetic CLS captures shifts visible at initial load, while CrUX captures shifts during further use. If synthetic CLS is low but CrUX CLS is high, the unexpected shifts may occur after the initial load.
- Which page types are affected? See the Pages report for CLS trends by page type. Both synthetic and CrUX data will show whether the issue is site-wide or part-specific.
- Can you see the change in the test run detail? Open the chart for synthetic results to access the test run detail with Lighthouse data. Compare with the previous day. Lighthouse can reveal root causes and optimization opportunities. Developers can also measure Web Vitals directly in the browser and view outputs from the test run detail there.
Focus on CLS optimization as an ongoing effort, not only when problems arise.
Summary
Evaluating Watchdog alerts, alongside the monitoring itself, is a crucial part of improving or maintaining fast website performance.
It’s important to designate who on the team will monitor and evaluate alerts and to perform this regularly. It requires technical skills and familiarity with metrics and the web.
If you haven’t yet, we recommend reading up on how Watchdog works and how to properly configure email or Slack alerts.