Notes in Charts: The Key to Evaluating Site Speed Changes
Notes in charts help you evaluate the impact of changes you’ve made to your site more easily.
Our PageSpeed.cz PLUS monitoring also adds some notes automatically.
In this article you’ll learn not only how to add and edit notes, but also our guidance on how to approach them.
Why Keep a Web Change Log?
During web development, many changes occur that affect speed.
Notes in the charts of our speed monitoring let you record these pivotal moments, so you can more easily trace the causes of improvements or declines in metrics.
These events might include:
Other important events are changes to the measurement itself, such as changing the measured URLs. This is handled automatically by Monitoring PLUS, as described below.
Adding Notes to Charts
Notes can be added in Monitoring PLUS to any day in any chart:
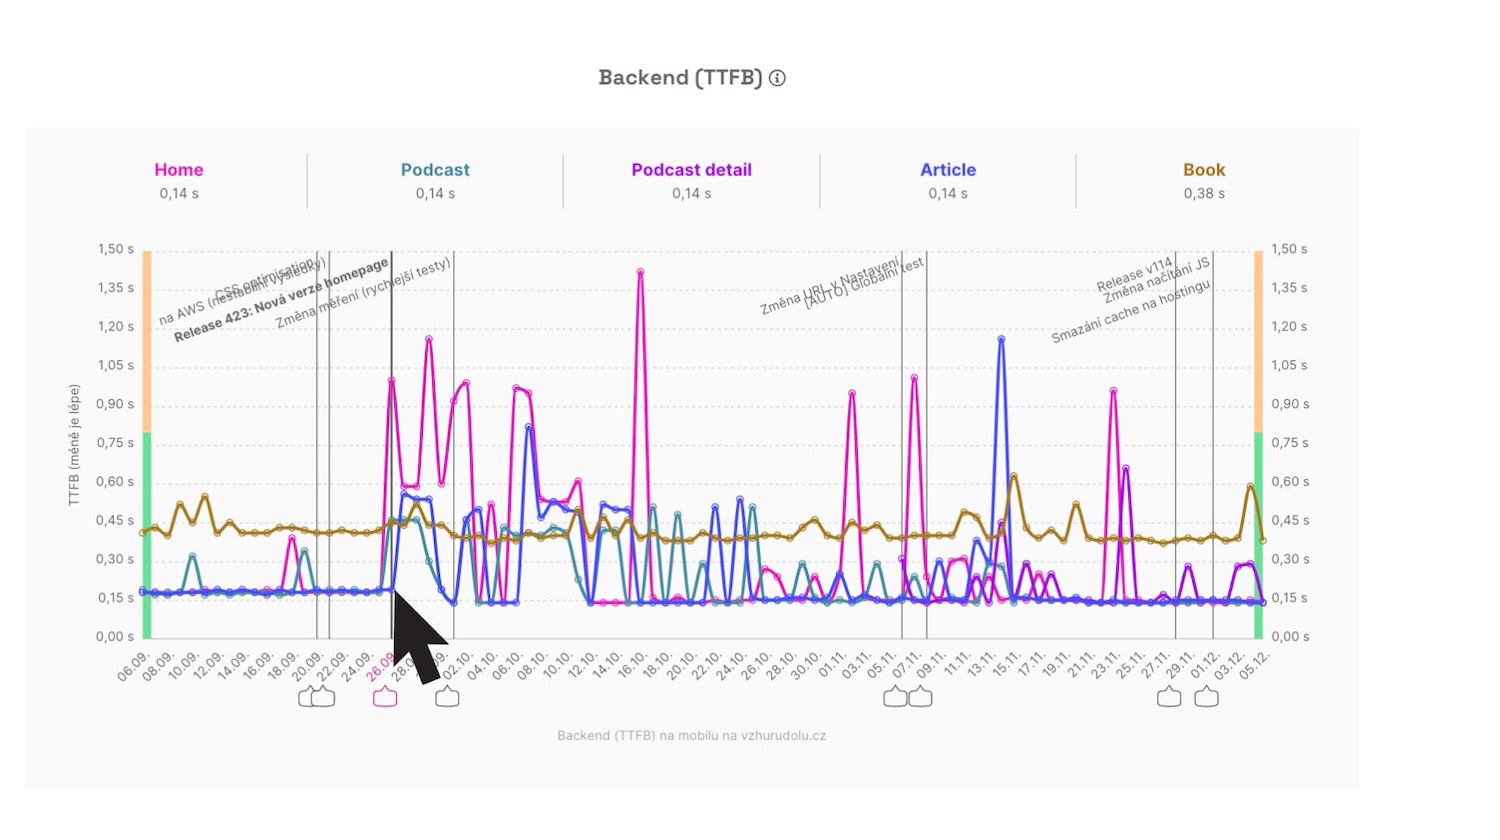
 Notes can be added by hovering over the dates on the timeline of all charts.
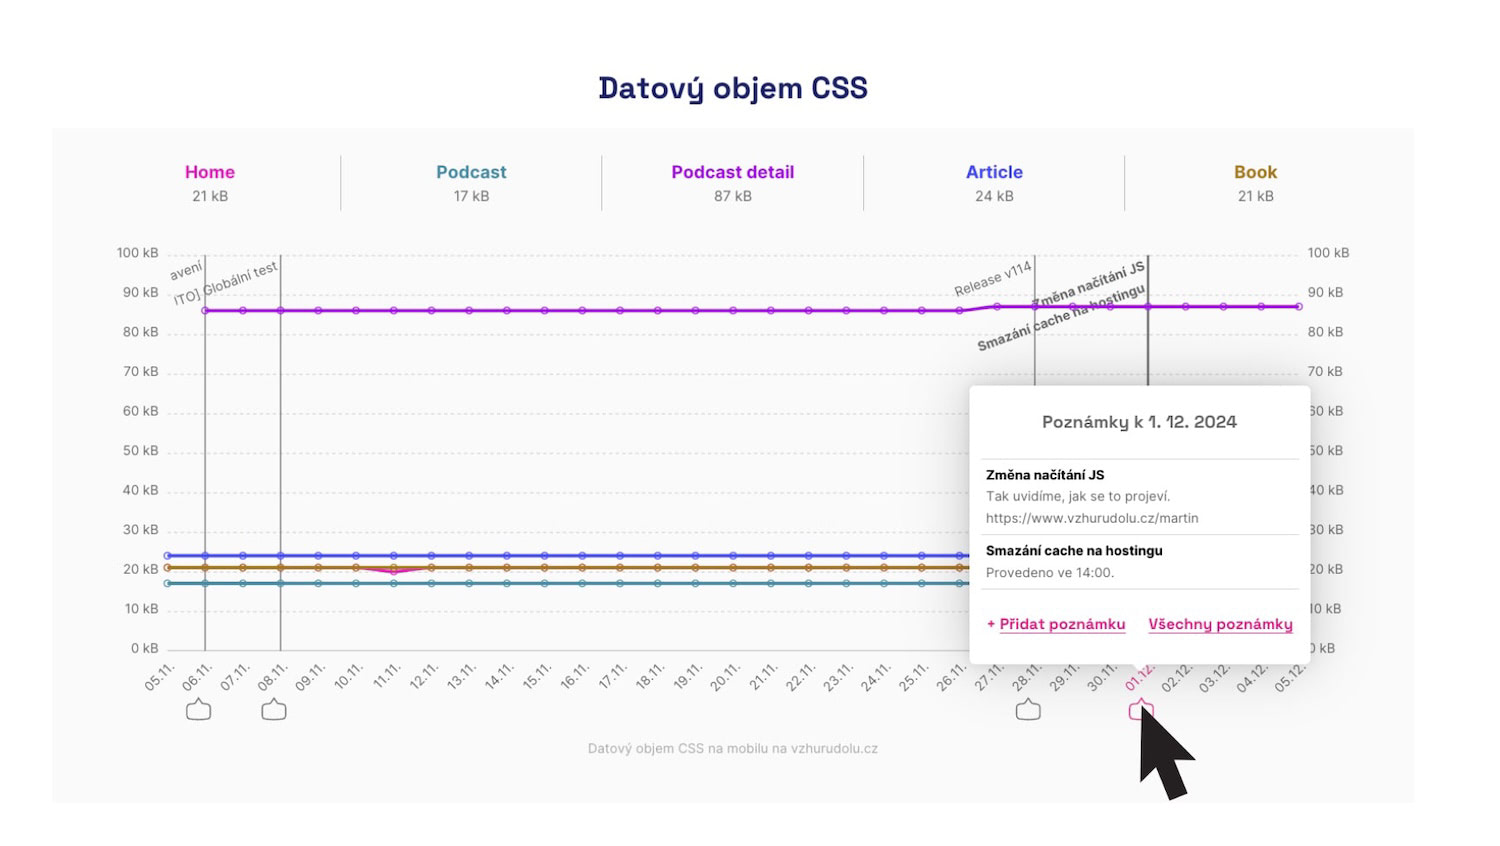
Clicking in the area under the chart opens a modal with the option to add (or edit existing) notes for that day.
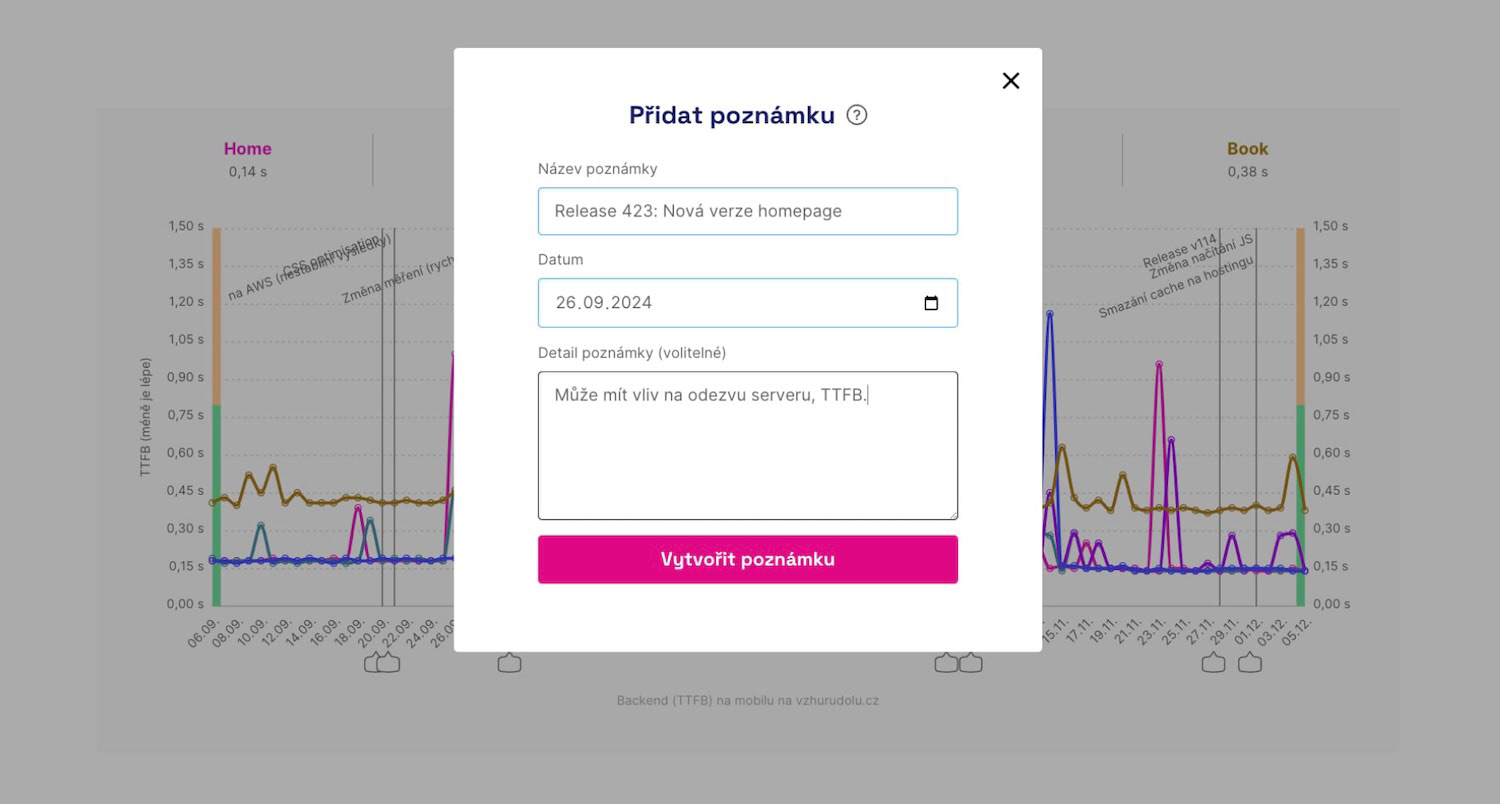 Deployed a new version of the site? Add a note to the chart.
In the charts you’ll then see these important changes, giving you context for further work and evaluation of changes.
 Notes appear in all charts, so you won’t miss any potential impact on any of the speed metrics.
Automatically Added Notes
PageSpeed.cz PLUS aims to handle as much as possible for you. Sometimes we insert notes automatically:
- Change of synthetic measurement settings When you change [URL in Settings], we add a note reading “Change of measured URLs.”
- Change of testing technology For example when we upgrade to a new Lighthouse version, we add a note like “Lighthouse 12.1.” We also notify this in our [changelog].
These notes are global, for all PLUS monitoring clients.
You’ll recognize them by the label [Auto] in the title or the Automated flag in the notes list.
The Notes Page
All notes can be viewed on the Notes page, accessible from the main navigation of every test:
 The Notes page is the home of all changes to your site or to the measurement.
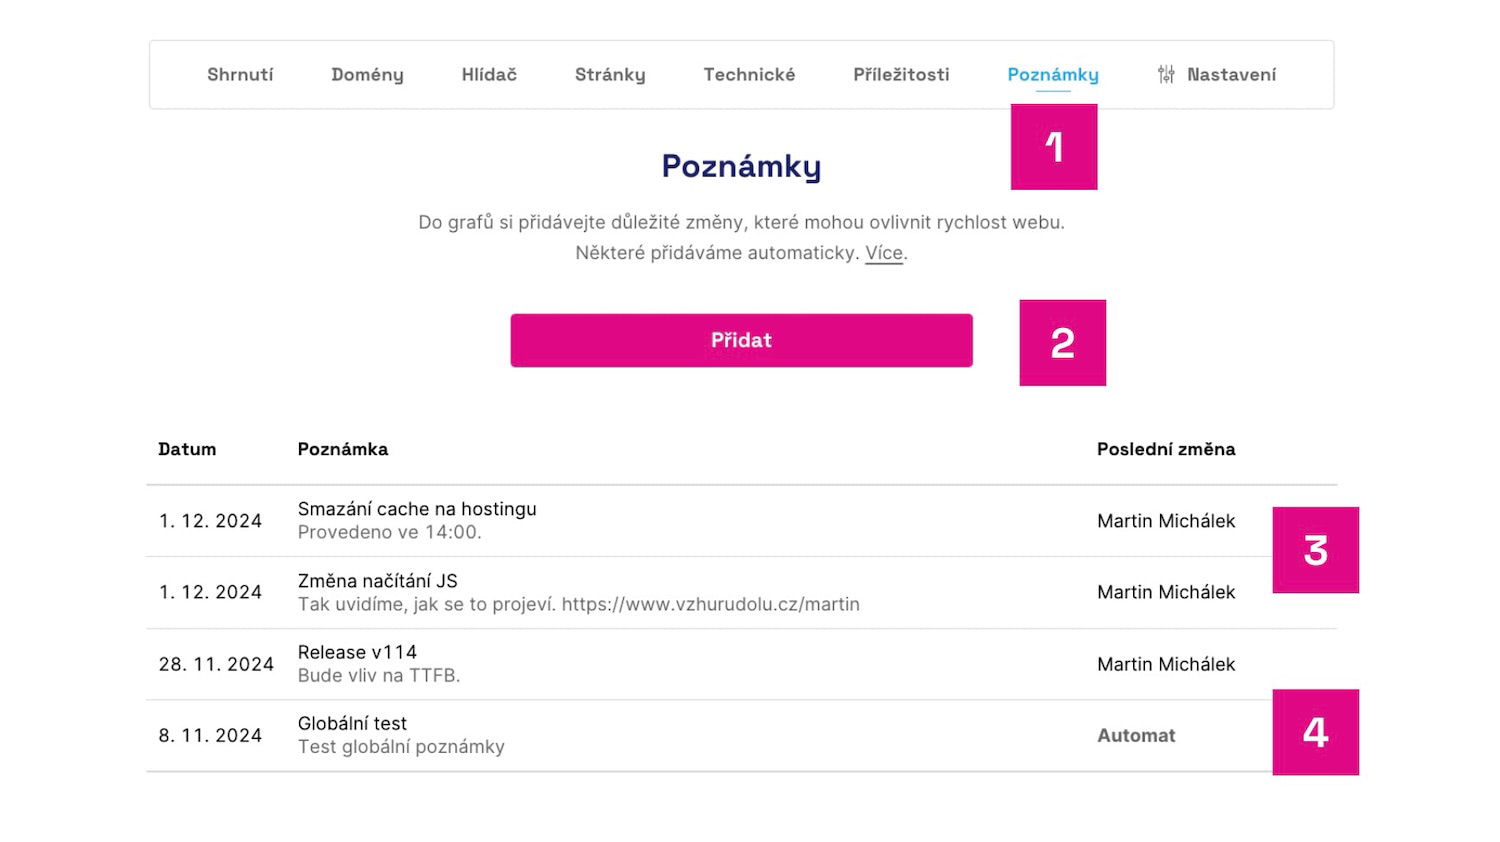
What do you see in the image?
- The Notes page in the test navigation.
- The option to add a note.
- User notes with the author of the last change.
- Automatic notes added by Monitoring PLUS.
Here you can again add, remove, or edit existing notes. Of course excluding those added automatically.
A Few Tips for Notes
- Only add changes that affect site speed. If you publish a new site version several times a week, you don’t need to add a note every time. You’d quickly overwhelm the charts. Add only changes that may influence speed.
- Don’t forget changes beyond technical development. Design tweaks often affect the [CLS] metric; adding third‑party components and running A/B tests can impact the [INP] metric. There can be many such cases. Always add important changes to Notes.
- Don’t hesitate to add notes retroactively. Notes best explain how a change impacted speed and teach you how to evaluate future adjustments. So feel free to add notes retroactively if you discover a change after some time.
In the future we’re also considering an API for automatic note creation.
Notes are a relatively unobtrusive but highly useful aid for anyone who cares about the speed of their own sites.