Testing Web Vitals in the Browser (A Developer’s Key Skill)
Core Web Vitals are the metrics we use to assess website performance in areas such as loading speed, interactivity, and layout stability. These metrics are increasingly important for delivering a good user experience, and Google uses them as a ranking factor in search results.
In practice, we still see developers lacking the knowledge to reliably test Core Web Vitals in the browser. Debugging isn’t just about implementing a change you think will improve metrics—you must also test its impact on them.
We strongly advise against blind optimization by trial and error, i.e., “deploy it and wait for the impact in user data.”
Better not rely solely on Lighthouse, which only provides synthetic measurements; you won’t get INP or CLS metrics under its limitations.
Testing Core Web Vitals in the browser complements regular automated website speed monitoring, which you should also have in place.
This article shows methods to test your site correctly.
What are Core Web Vitals?
Repetition is the mother of learning. The three core Core Web Vitals metrics are:
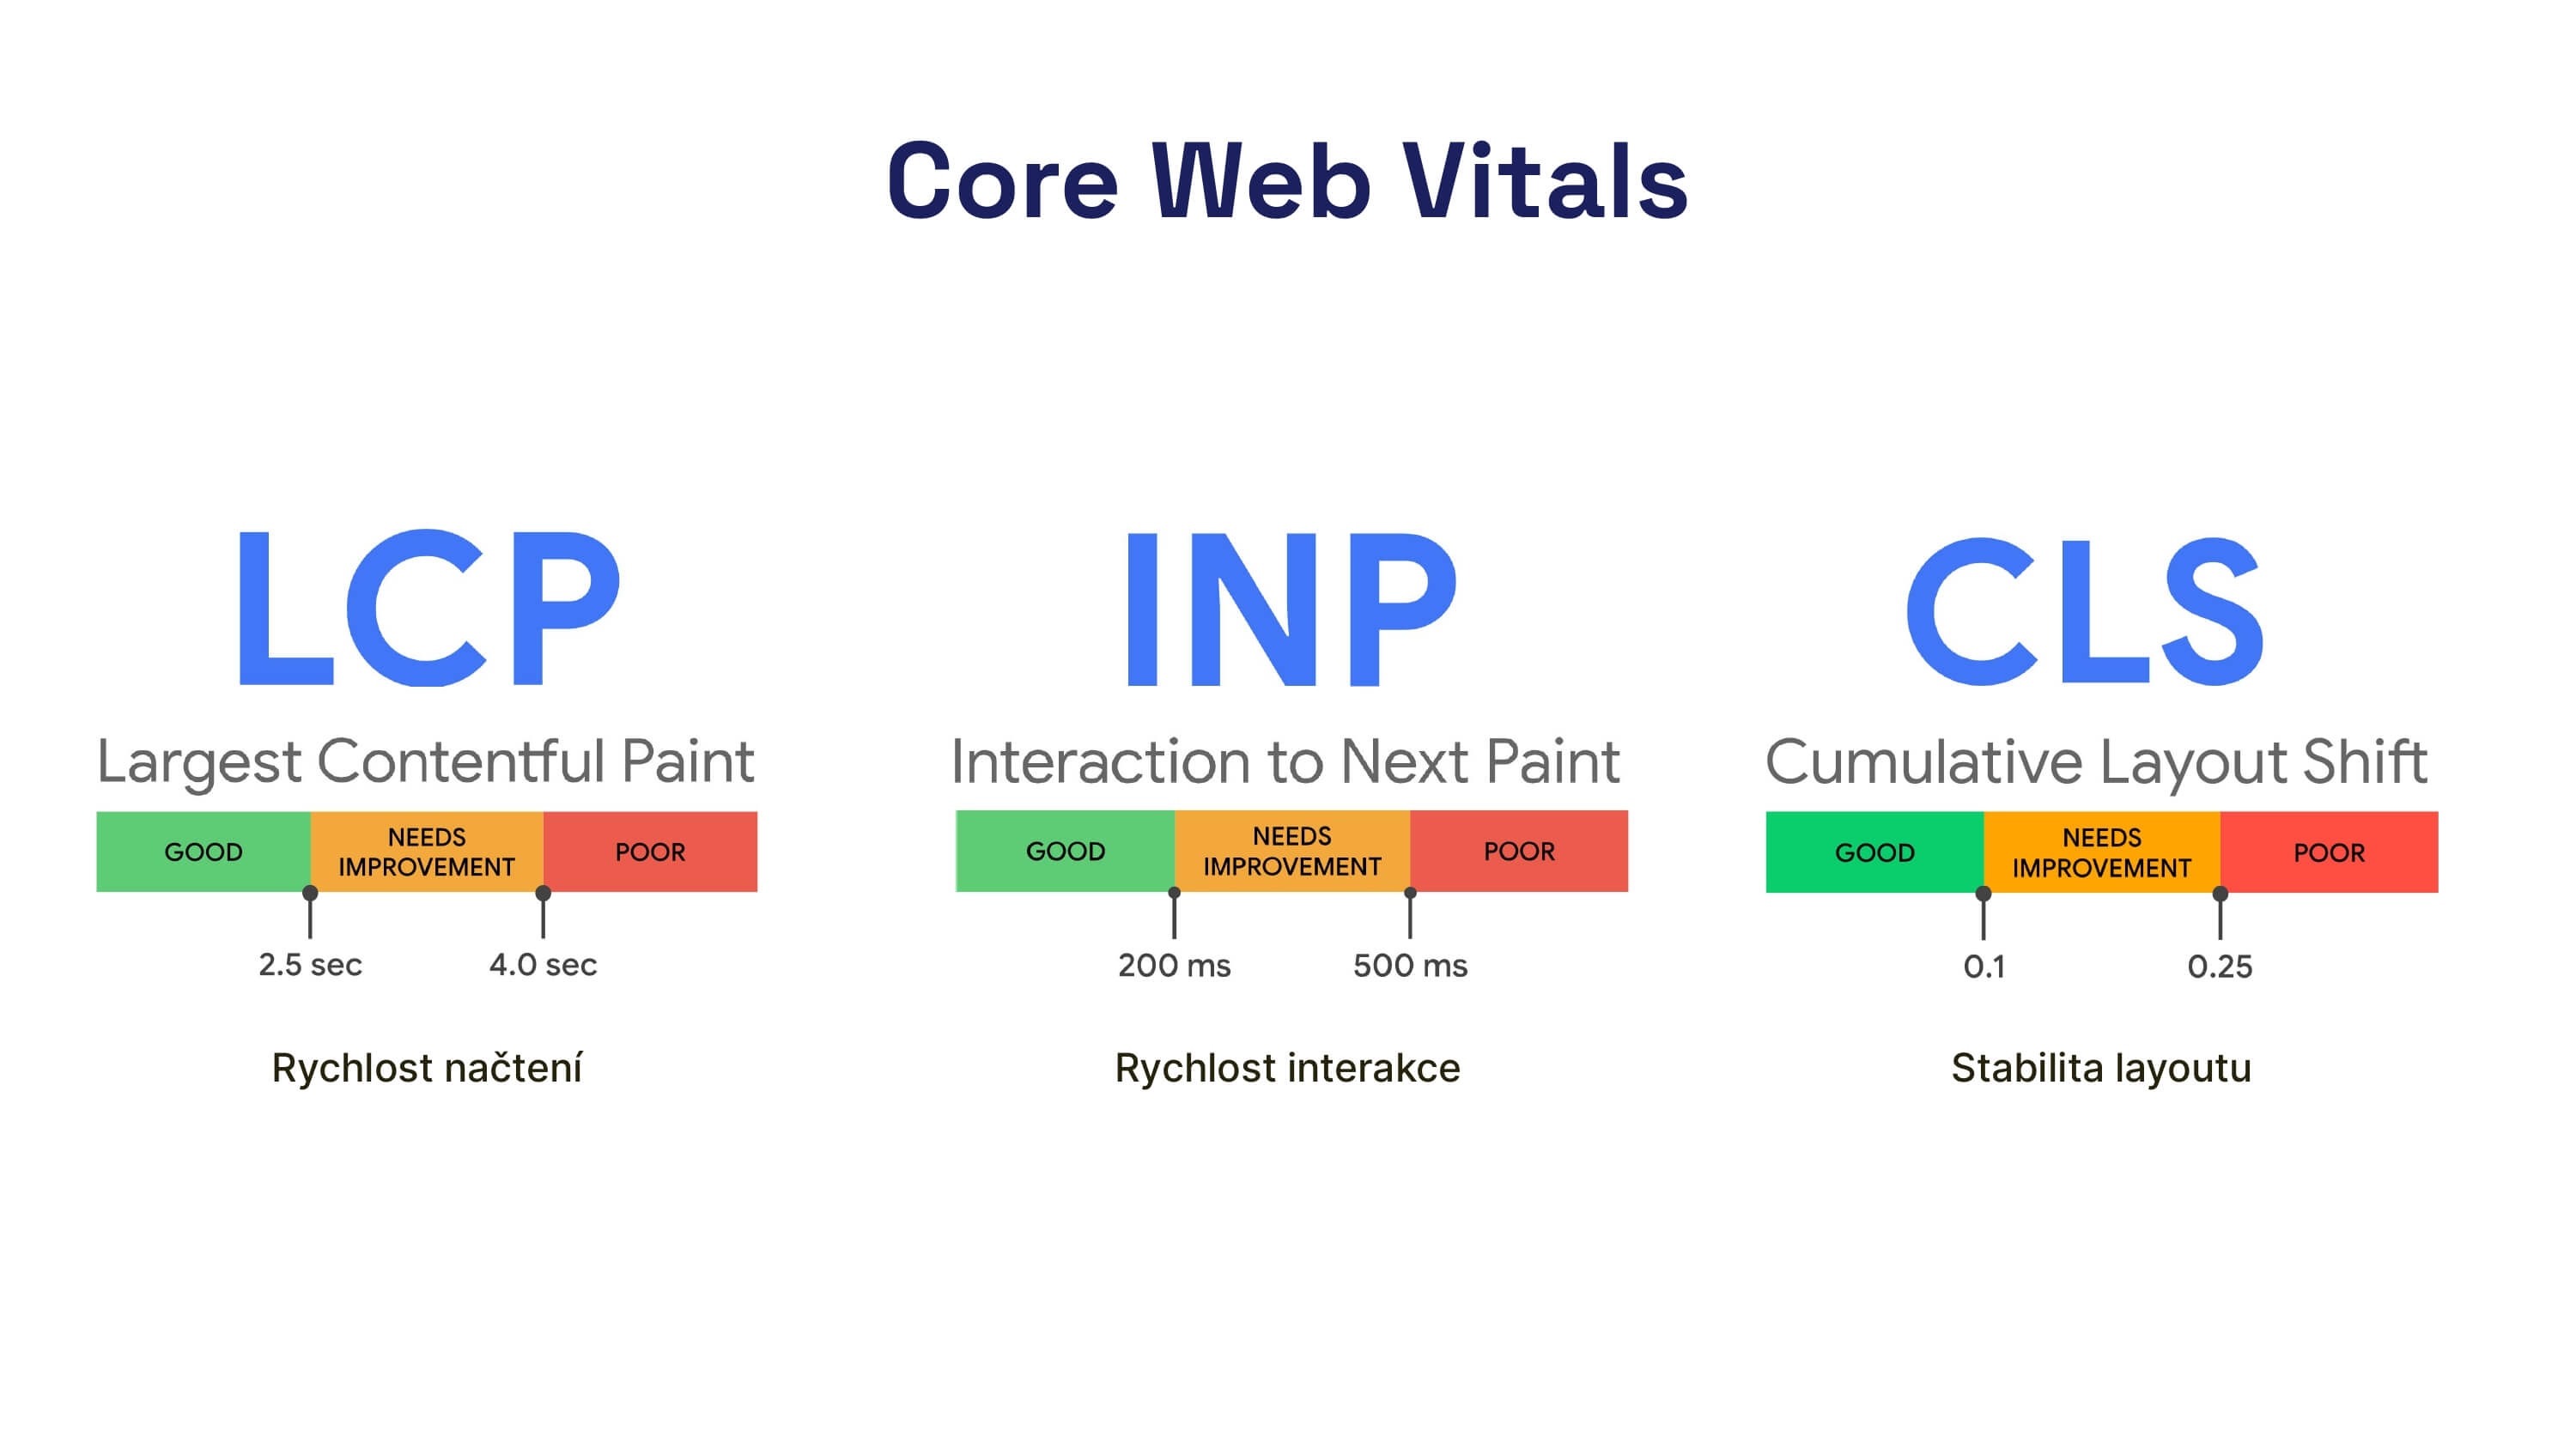 Core Web Vitals in all their glory. You’ll need to know how to test these metrics effectively.
- Interaction to Next Paint (INP) - how quickly the largest element loads.
- Largest Contentful Paint (LCP) - the site's responsiveness after user interactions.
- Cumulative Layout Shift (CLS) - layout stability.
Why not use Lighthouse in the browser?
Lighthouse can help with debugging speed, but we have strong reservations about it, so we don’t recommend it for testing metrics after developer tweaks.
It measures synthetic, machine-like metrics rather than real user metrics. See the differences between measurements here: /docs/synth-crux-rum.
The metrics Lighthouse reports apply only to the initial load and what happens in the first viewport (CLS is mismeasured, INP isn’t measured at all).
It’s not ideal for measuring LCP either, since it can test only a single context (e.g., a site with a cookie consent bar). For deeper discussion, see Martin Michálek’s article Lighthouse Performance Score (LPS): the beauty and pitfalls of the metric of all metrics.
 Lighthouse can help, but it isn’t sufficient for in-browser testing.
How to test Core Web Vitals in the browser
Our primary testing tools will be the browser’s Dev Tools in Google Chrome. They include hidden but powerful features that significantly ease our work.
Today we’ll focus on the Web Vitals Chrome extension and the Performance panel.
Web Vitals Chrome Extension
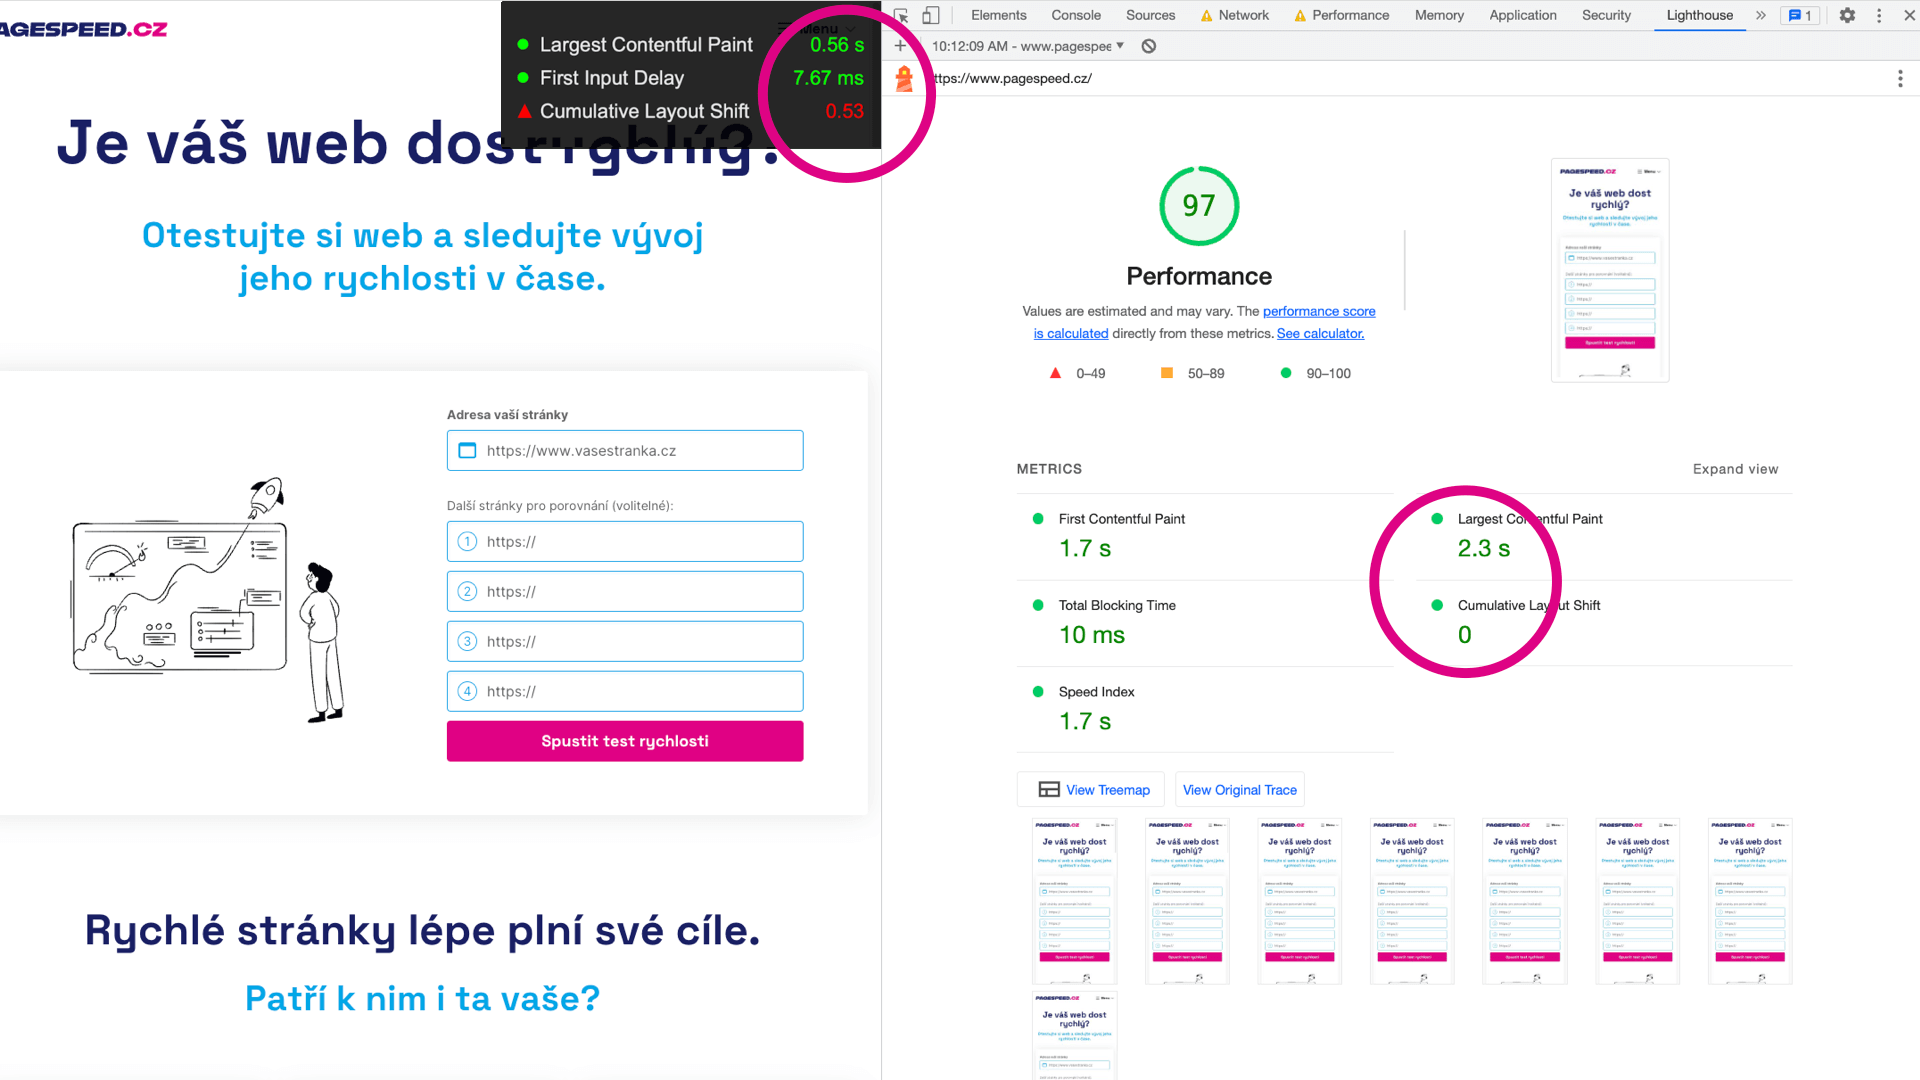
The easiest way to test Web Vitals is to open the Web Vitals extension in your browser. It displays metrics for any page you visit.
We recommend pinning Web Vitals to the extension toolbar so it’s always at hand. On a page, just click its icon and on reload you’ll see a metrics table.
 Web Vitals Extension.
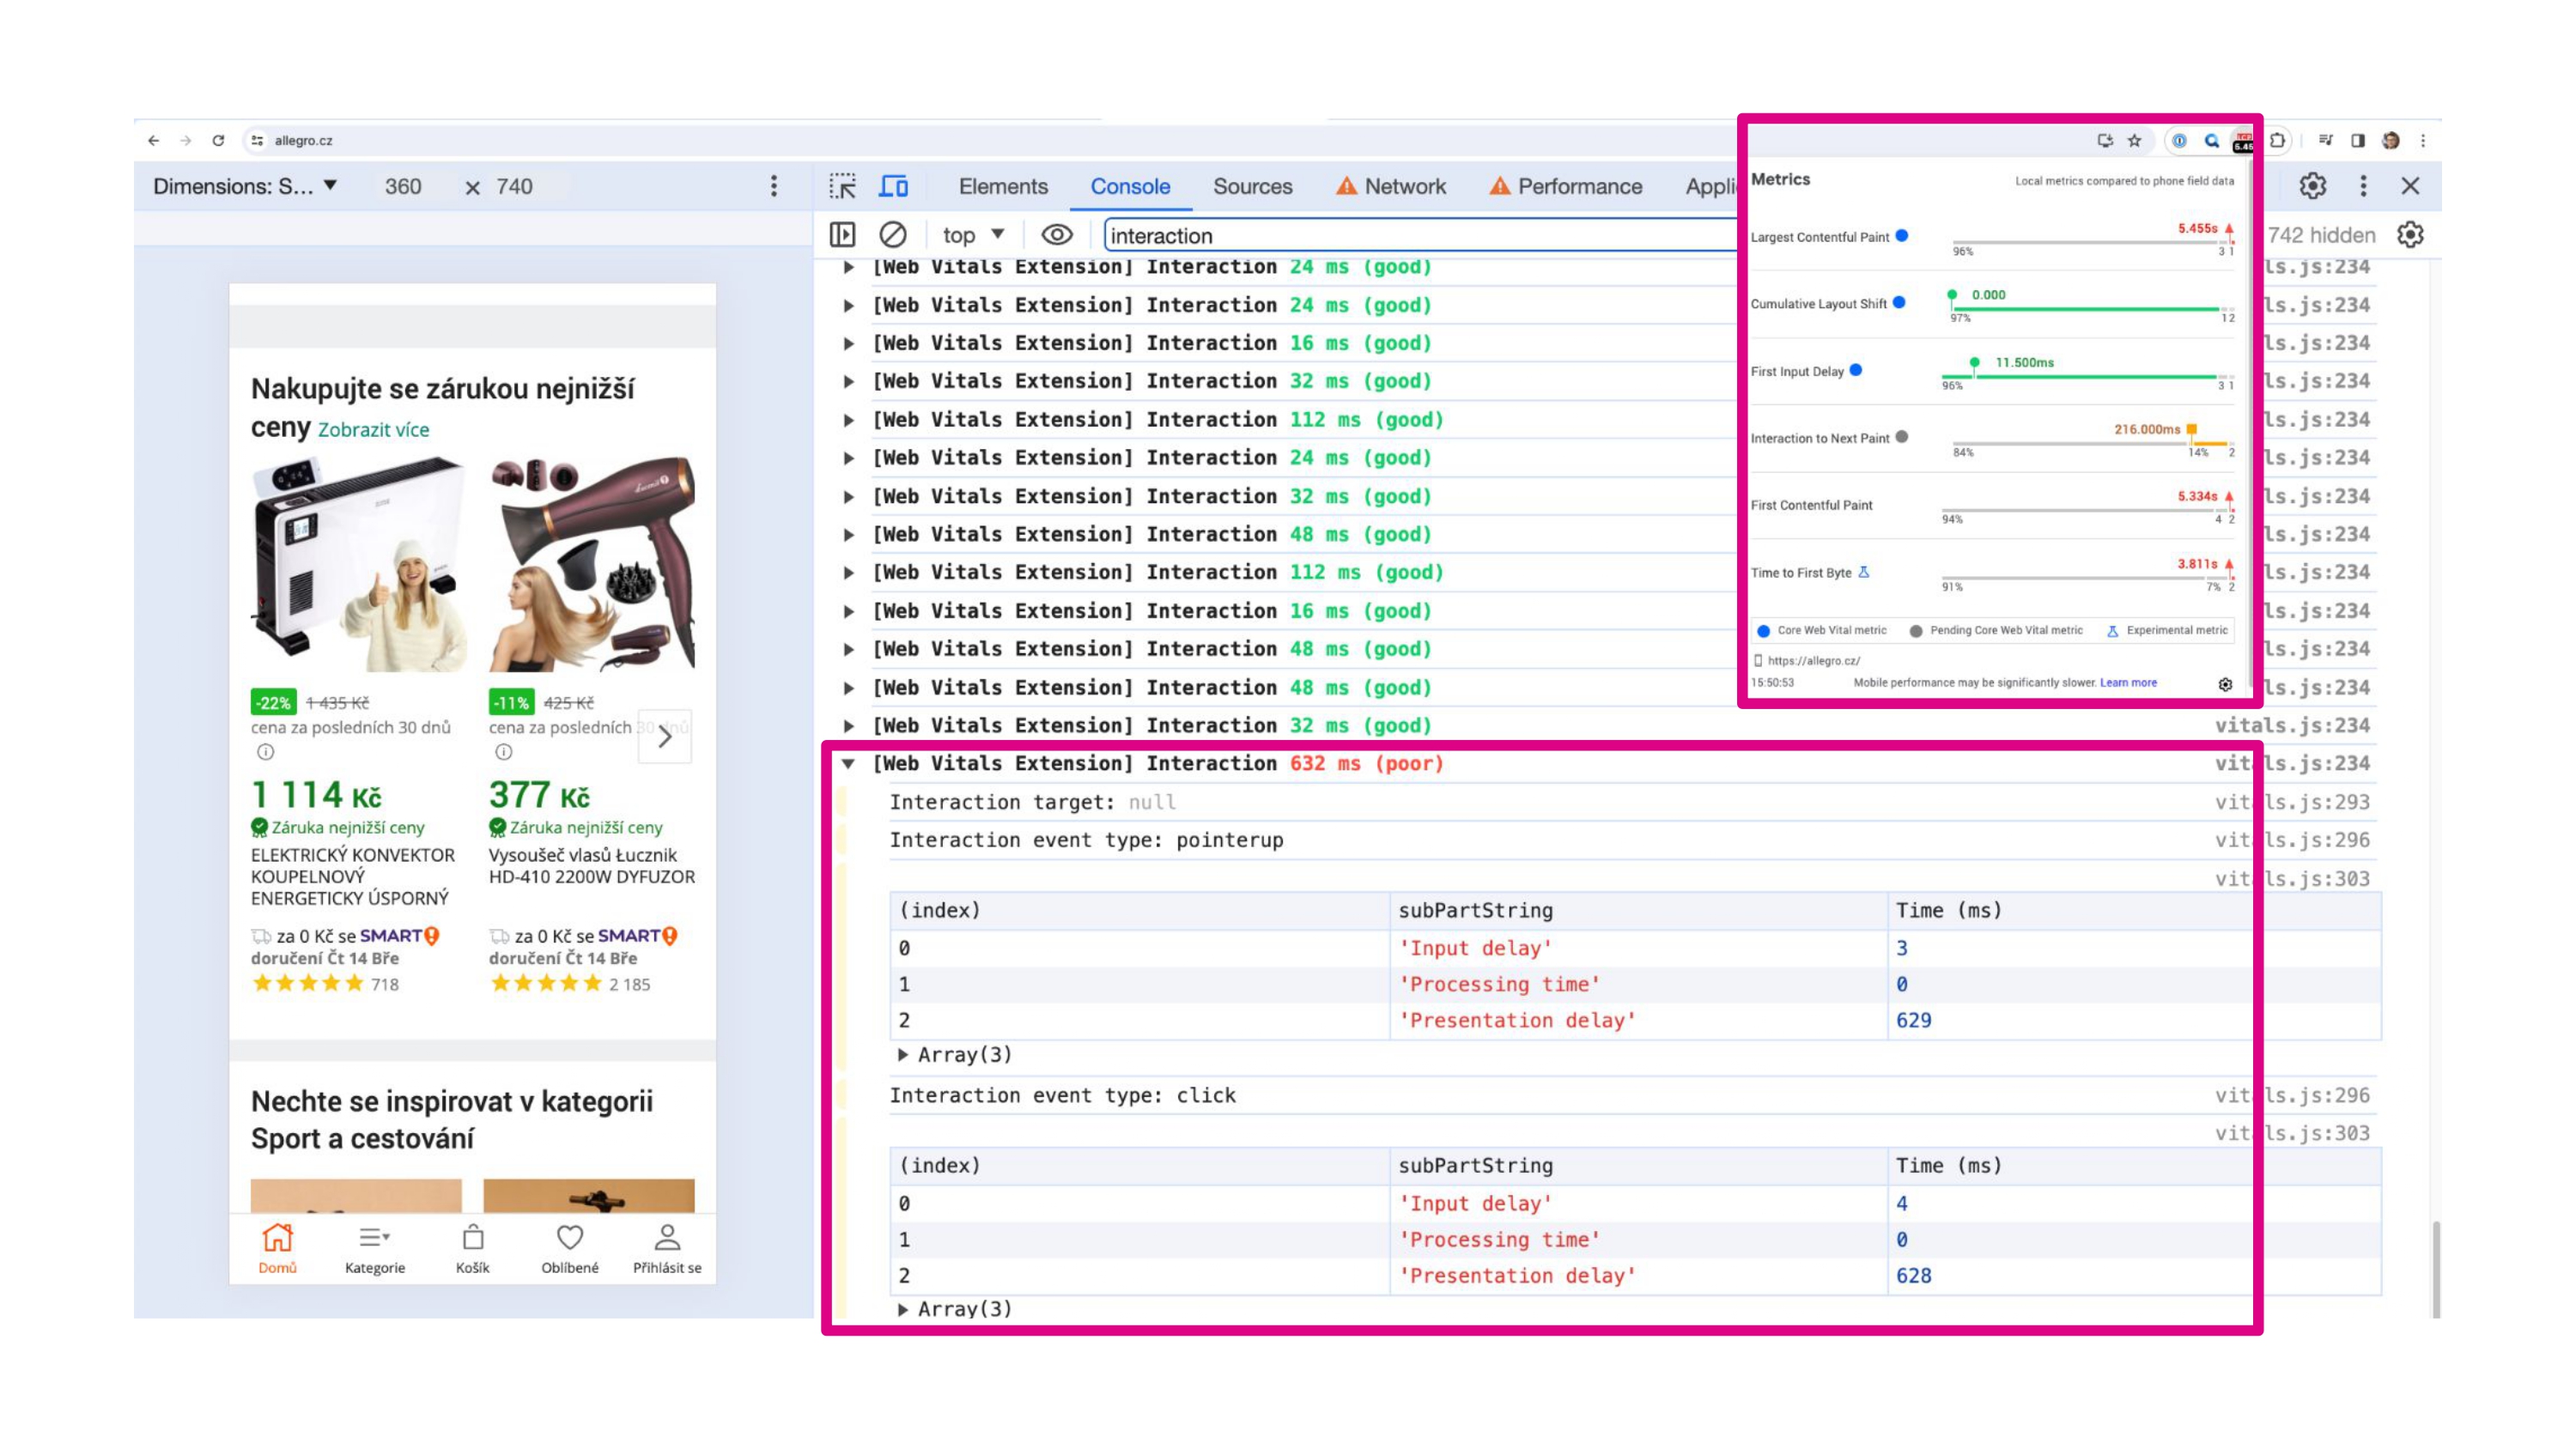
In the extension settings, also enable “Console logging.” This lets you debug advanced details about each metric directly in the Console tab of DevTools.
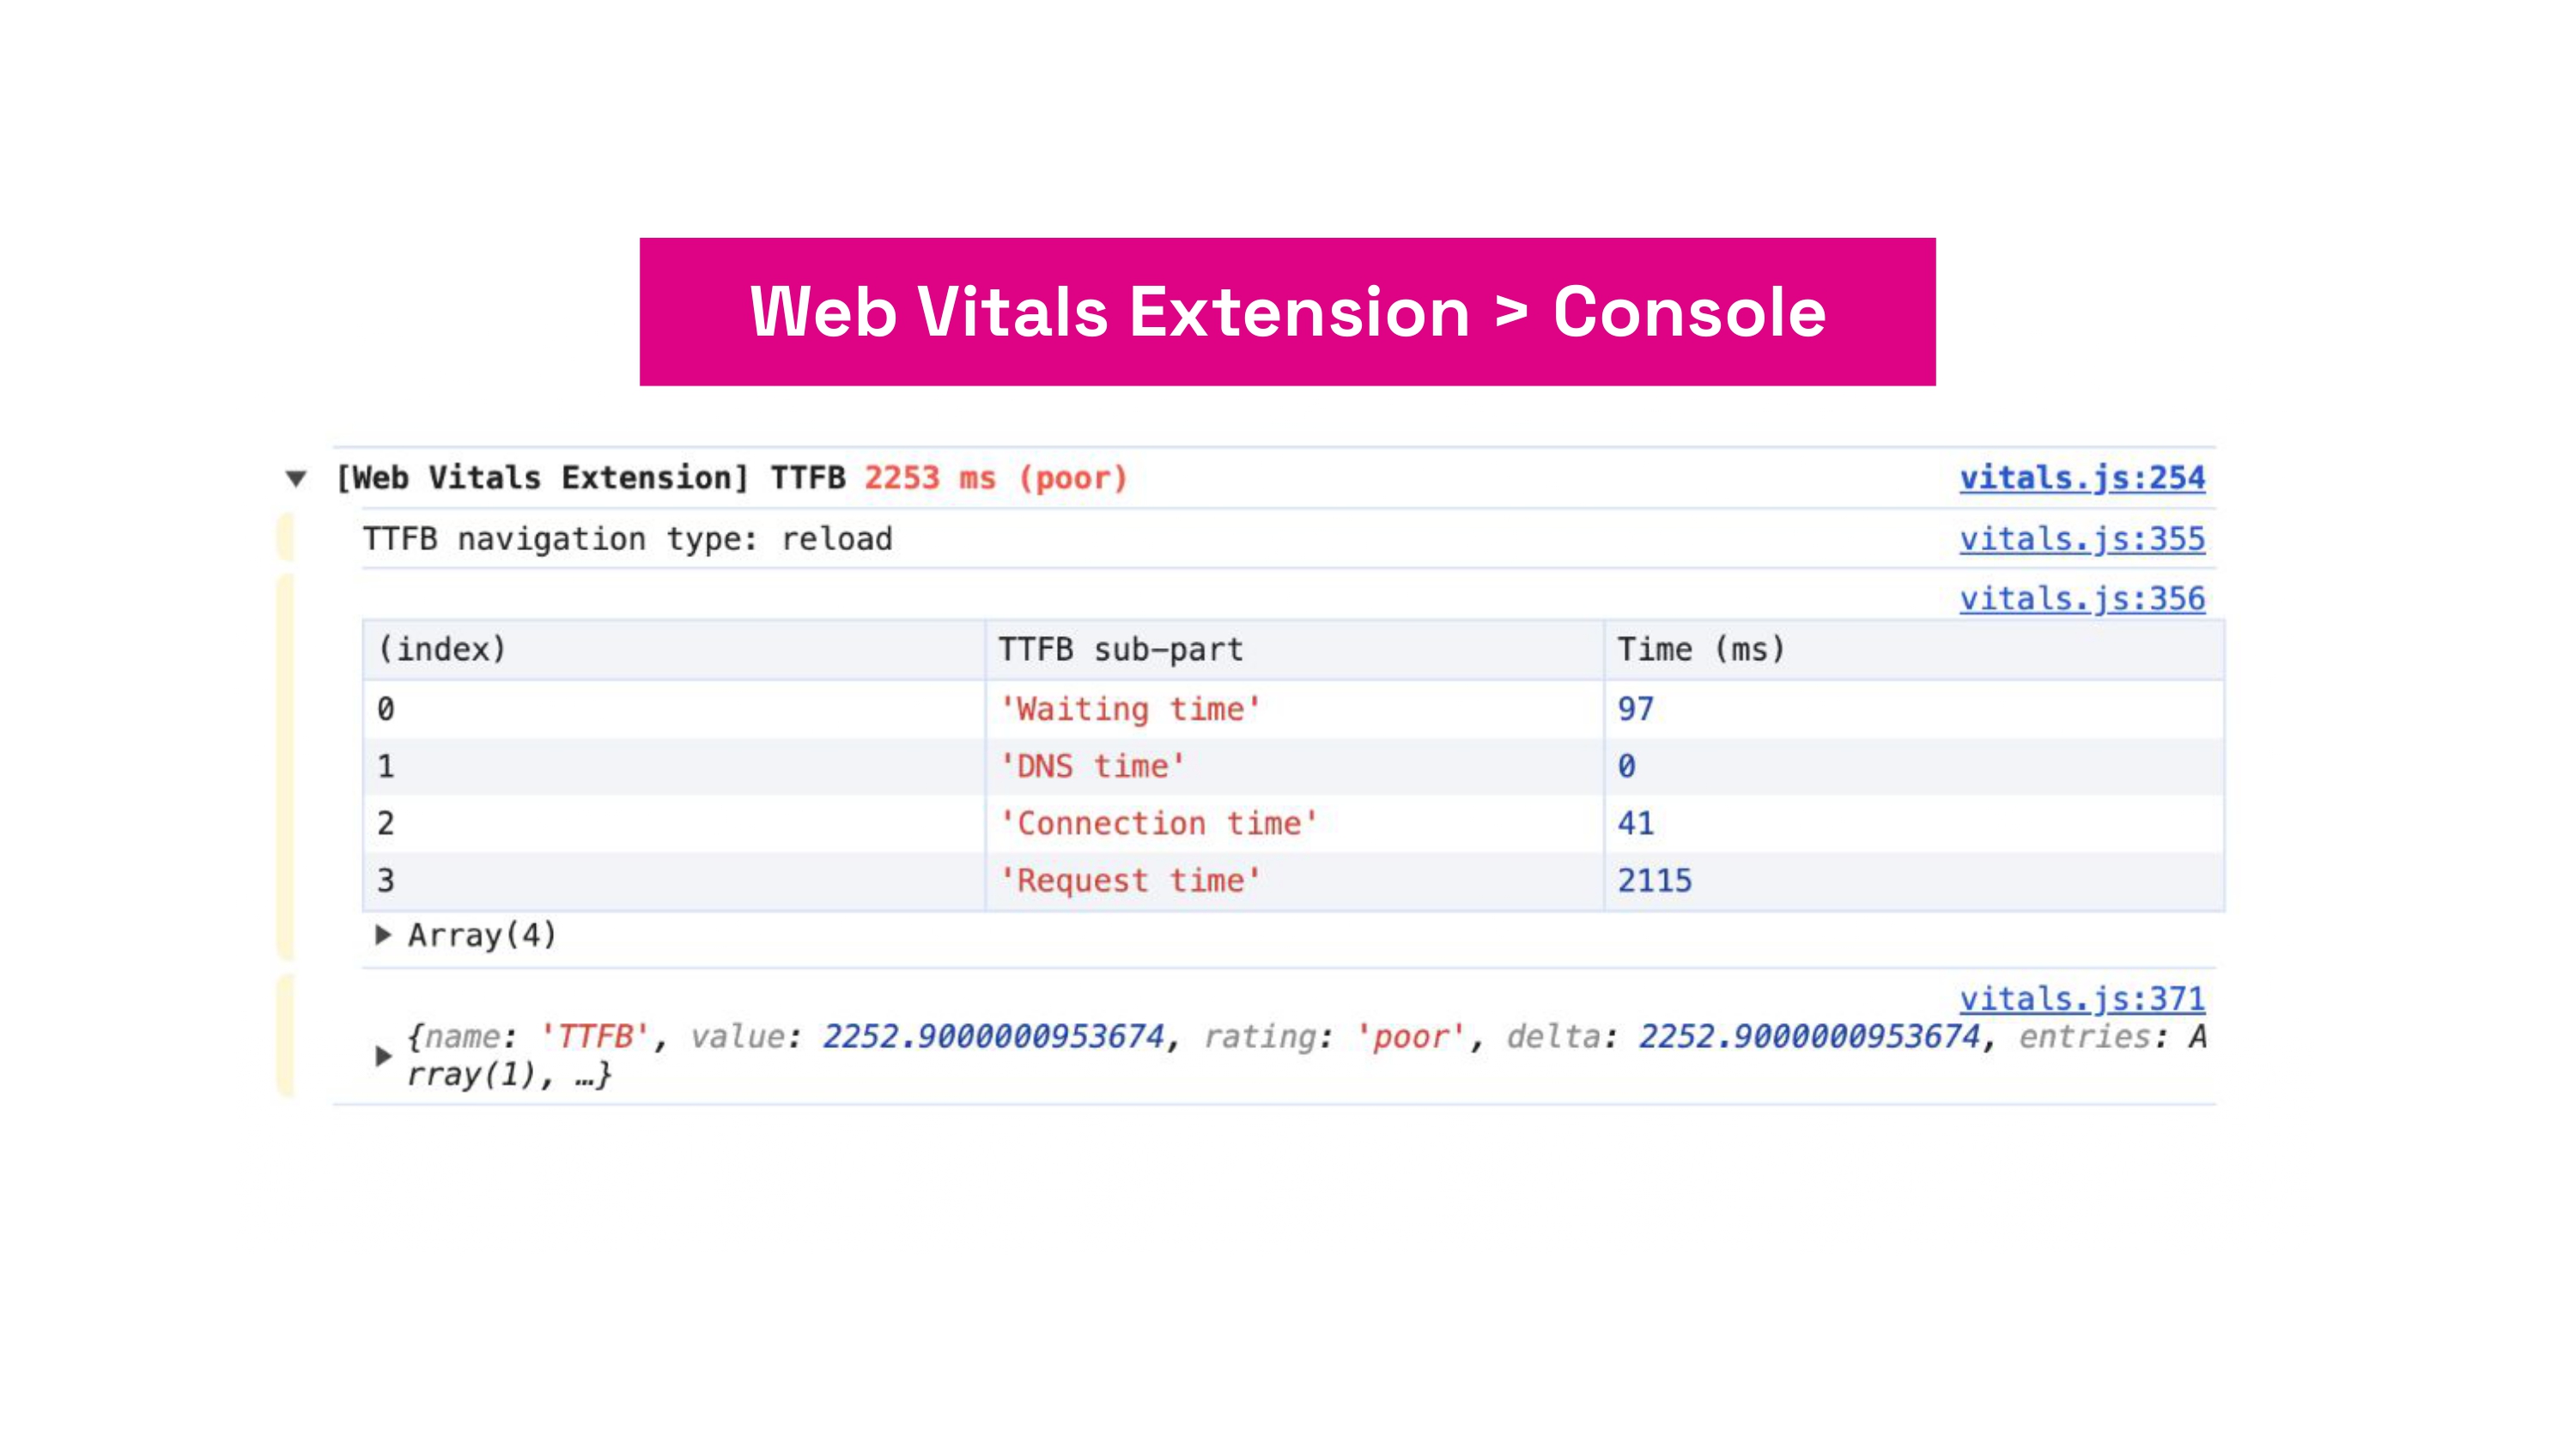 Console logging with Core Web Vitals.
We use the Web Vitals Extension to test all three metrics. An advantage is that you can slow down the network in the Network panel to measure metrics under simulated conditions.
Performance panel
The Performance panel received a new look in September 2024 and offers two modes—Metrics state and Detailed measurement.
Metrics state in the Performance panel
This mode enables quick tests, similar to the Web Vitals extension.
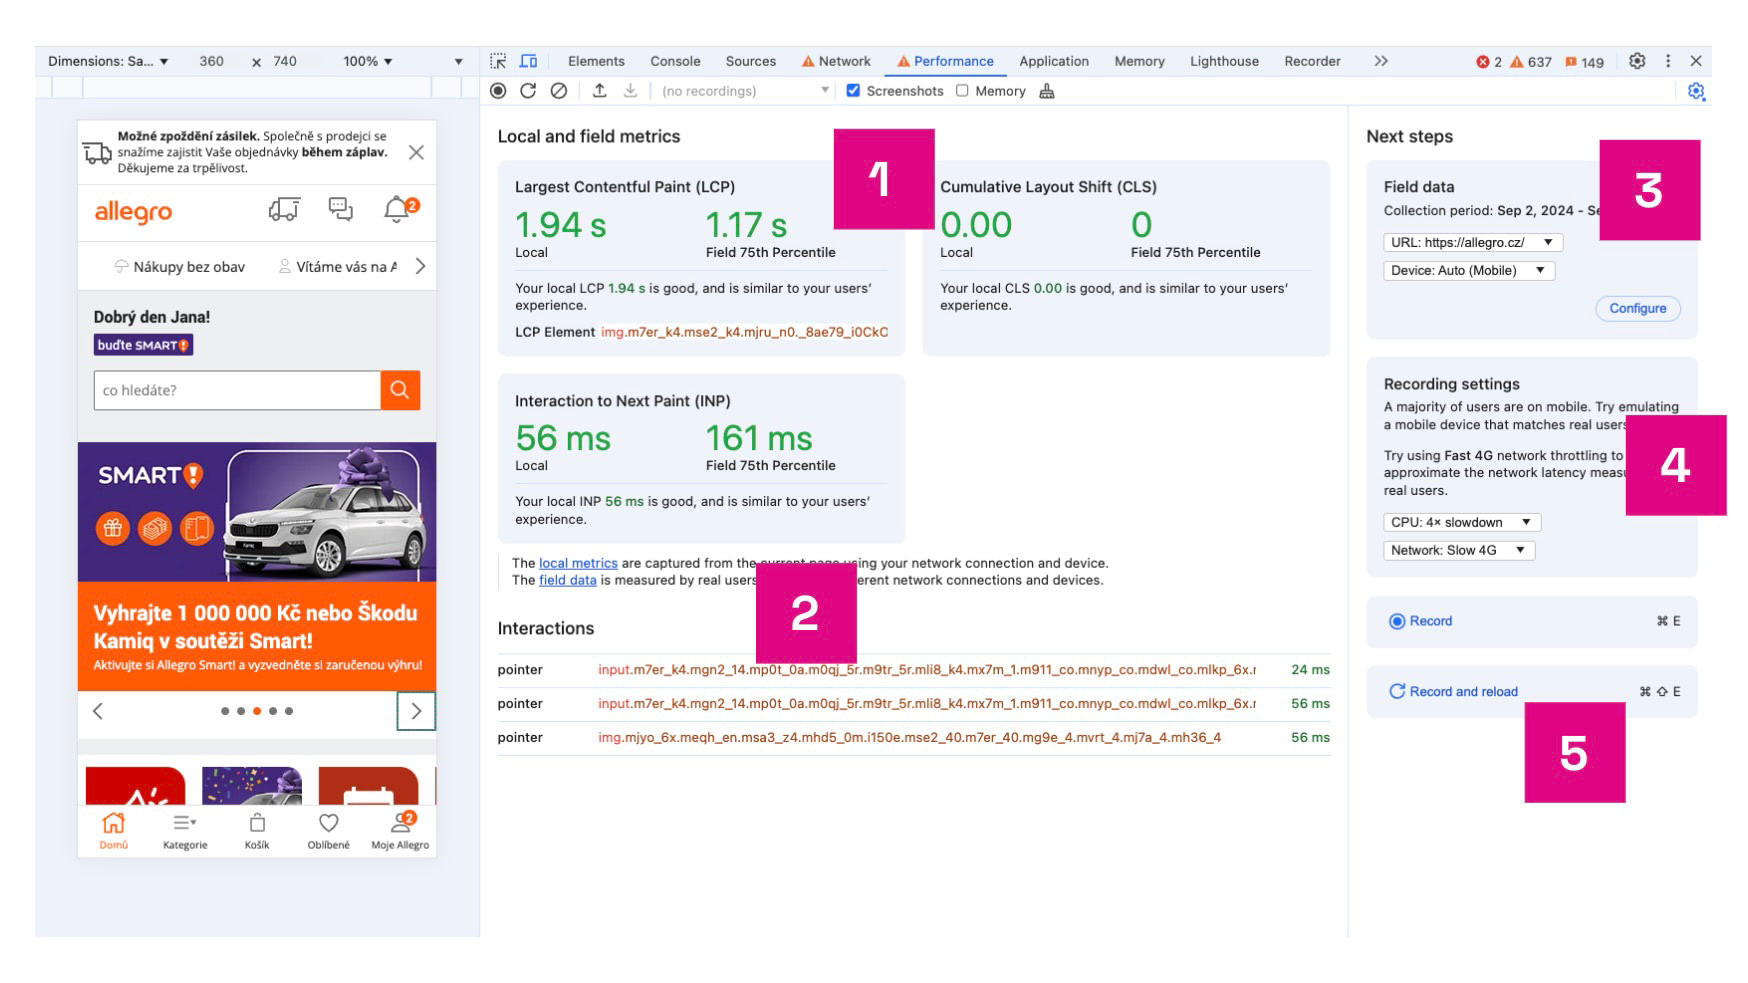 Metrics state in Performance for quick site testing and interaction analysis.
Here’s what you see:
- Live on-page metric state that updates as you use the page, with a comparison to data from the Chrome UX Report.
- A logging panel for interactions (INP) or layout shifts (CLS).
- A panel option to download data from the Chrome UX Report.
- Testing parameters—we recommend at least 4x CPU slowdown and a slower 4G connection.
- Upload a detailed measurement — switch to a full recording of page loads and interactions. See more below.
Detailed measurement in the Performance panel
We jokingly call this tool “the worms” due to how it visualizes executing JavaScript. Still, it offers many useful tabs. For our needs, the key sections are “Web Vitals” (shown as #1 in the image), “Timings” (2), and “Experience” (3).
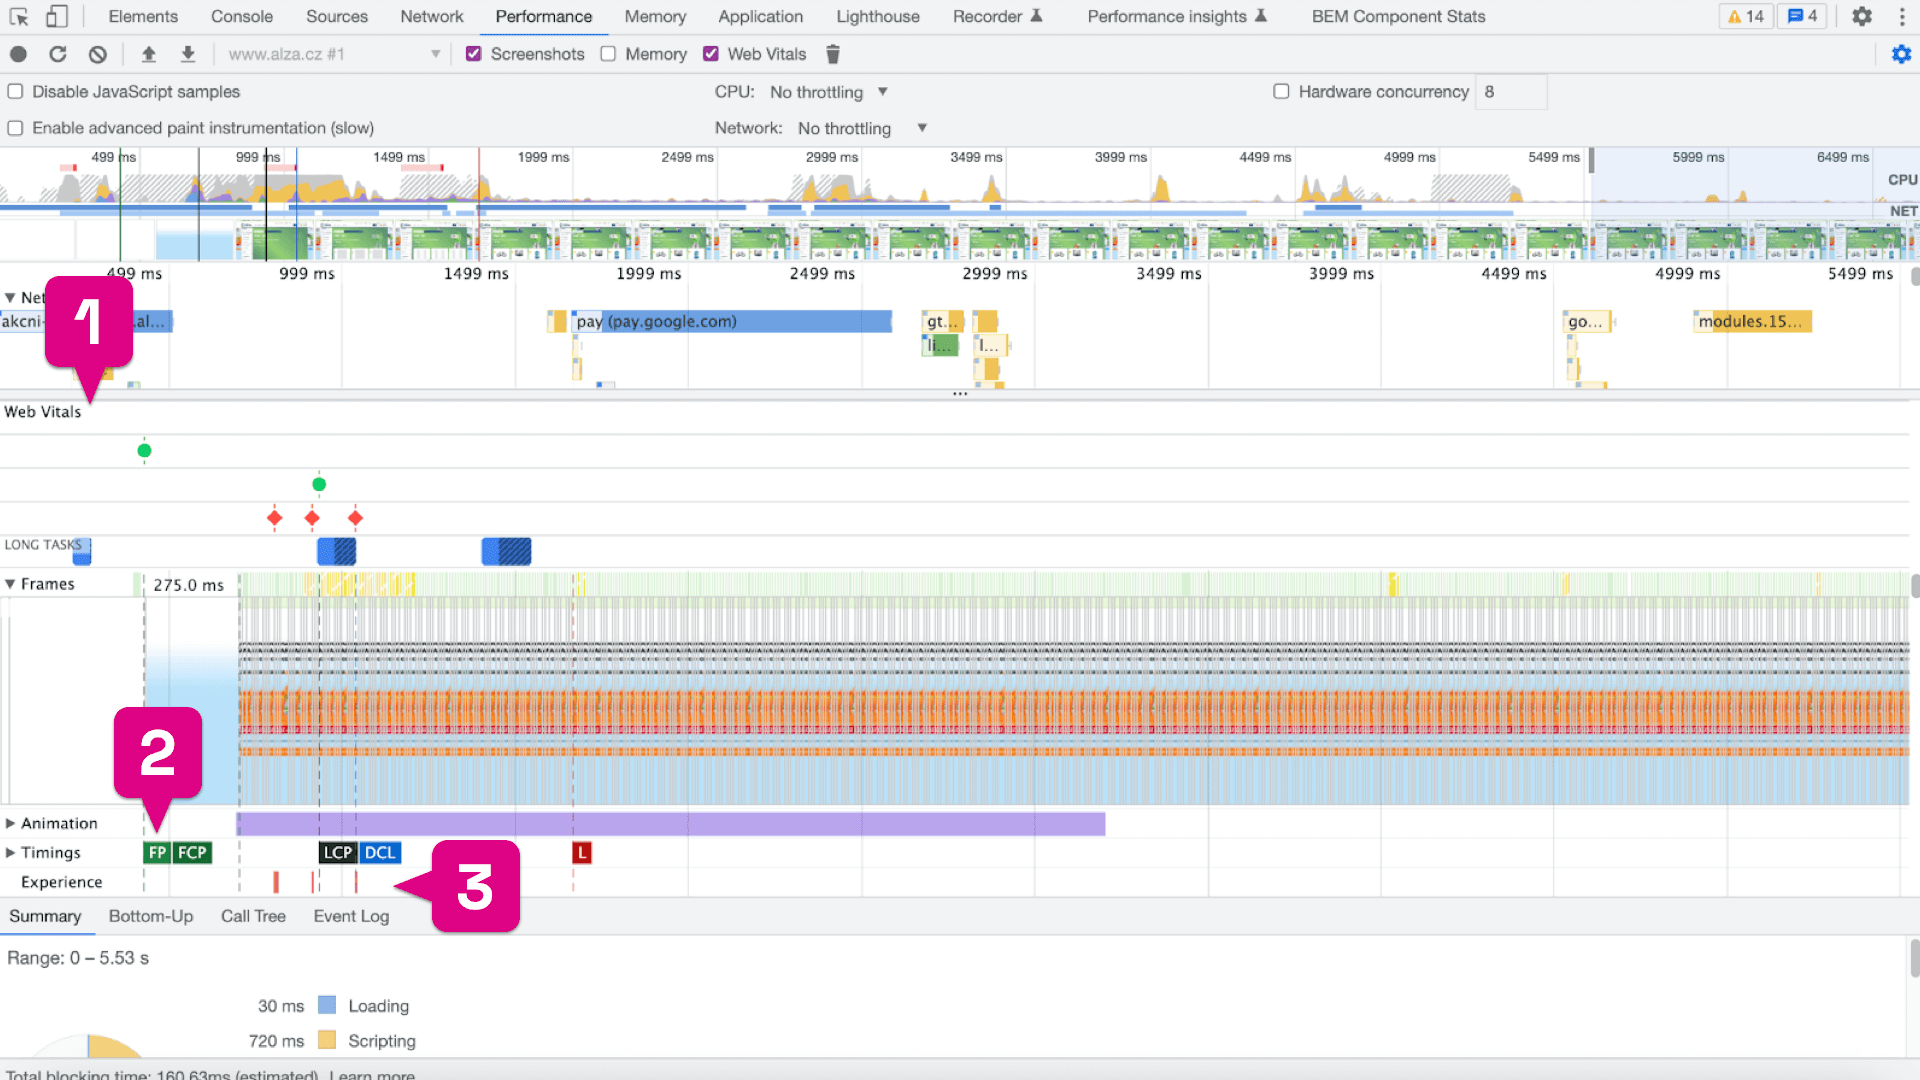 Panel Performance
The Web Vitals section is the first in Performance and reports timing data for the metrics.
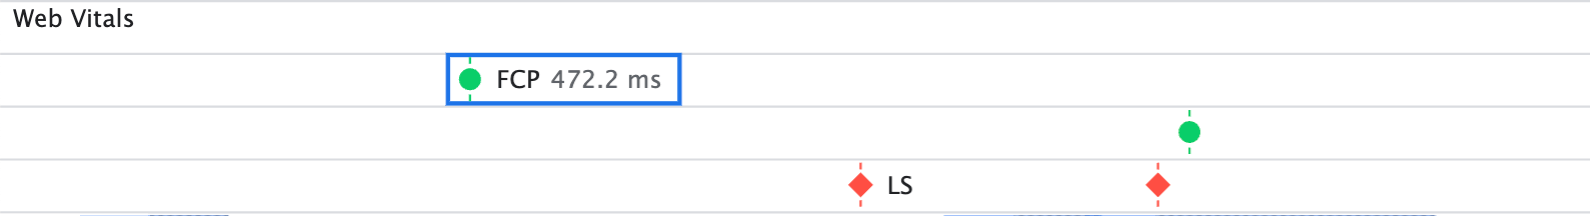 Panel Performance
The Timings section is similar, but for LCP it also provides valuable details about the specific element, its size, and type.
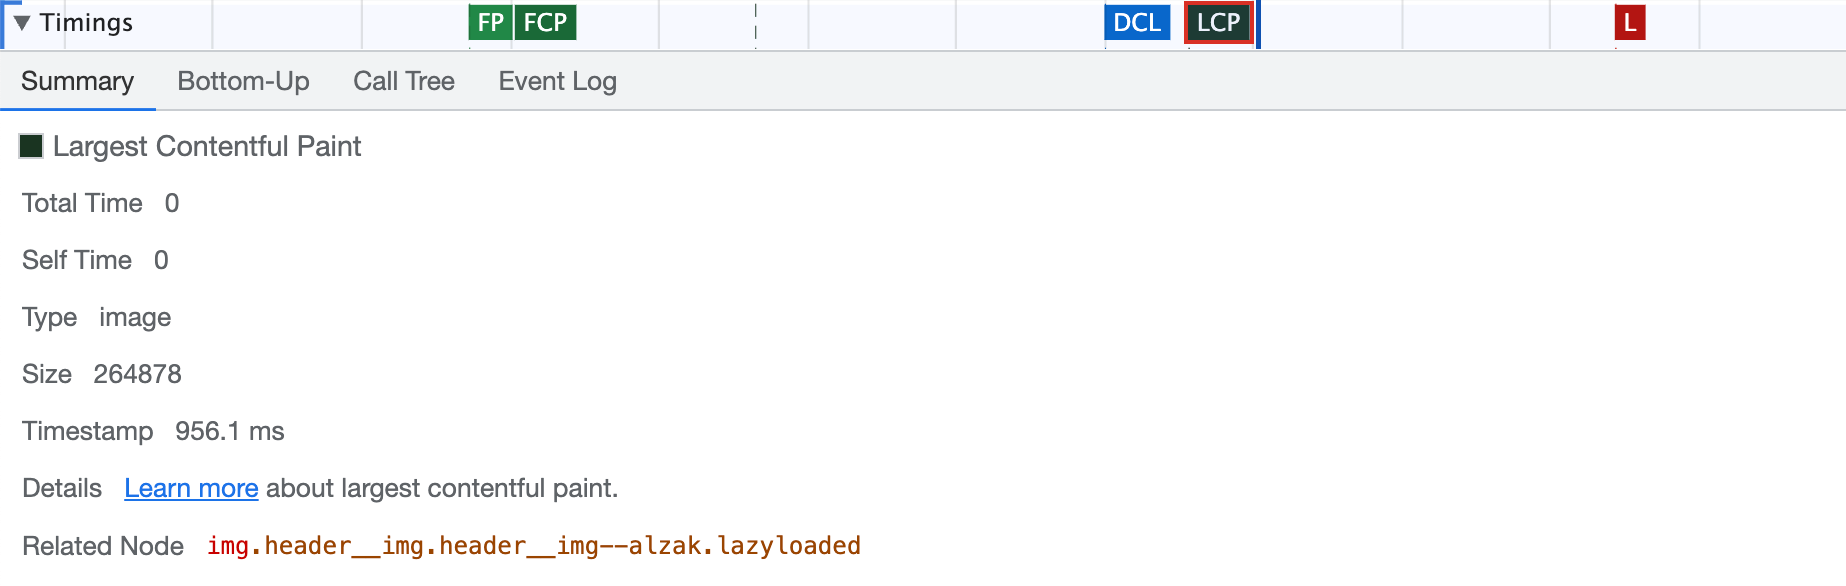 Panel Performance
The Experience section is most useful for CLS testing, as it shows a detailed breakdown of measured layout shifts. Click the red square indicating the issue to see details like those below.
 Panel Performance
It’s worth noting that you can download the Trace recording from the Performance panel from the test run details page of our PLUS monitoring.
In conclusion
Remember that optimizing Core Web Vitals metrics also helps deliver a better user experience. Any changes aimed at improving the metrics should always be tested.