Website Speed Monitoring: Why It Matters and How to Use It Effectively?
Something suddenly isn’t working. Conversions drop, visitors vanish, the site slows down, but you don’t know why. Nothing major changed, so what’s the problem?
Maybe your site has been slowing down for months without you noticing. Maybe you launched a new feature last week that slowed key pages. Maybe a third party changed its code and didn’t tell you. Without monitoring you have no chance to find out what’s going on.
Website speed monitoring gives you visibility, control, and a way to address issues before they impact your business.
What is this article about?
- Why is site speed key? Impact on conversions, SEO, and user satisfaction
- How monitoring saves you time and money — ROI and business impact
- What kind of monitoring do you need? Why it’s good to combine different types
- Why one-off tests aren’t enough — the difference between PageSpeed Insights and continuous monitoring
- How to set up and use monitoring — our approach that saves time, money, and nerves
Tip: You can now sign up for a monthly trial of our monitoring. No card, no commitment.
Why monitor site speed? The business case: ROI and preventing mishaps
Site speed matters because it can directly affect conversions and site traffic. A few real-world examples from our experience:
- For Livesport, one of the largest sports results providers, speed optimization helped improve Google Ads performance, saving a substantial PPC budget.
- Studies show that backend response time correlates with search rankings, so faster speed benefits SEO. On several clients we’ve seen traffic increases after Core Web Vitals optimizations.
- On a large e-commerce site we observed users with around 1 second load times converting 3.5x more than users at about 2.5 seconds.
Let’s look at a graph showing the correlation between speed (LCP, yellow) and conversion rate (CR, blue):
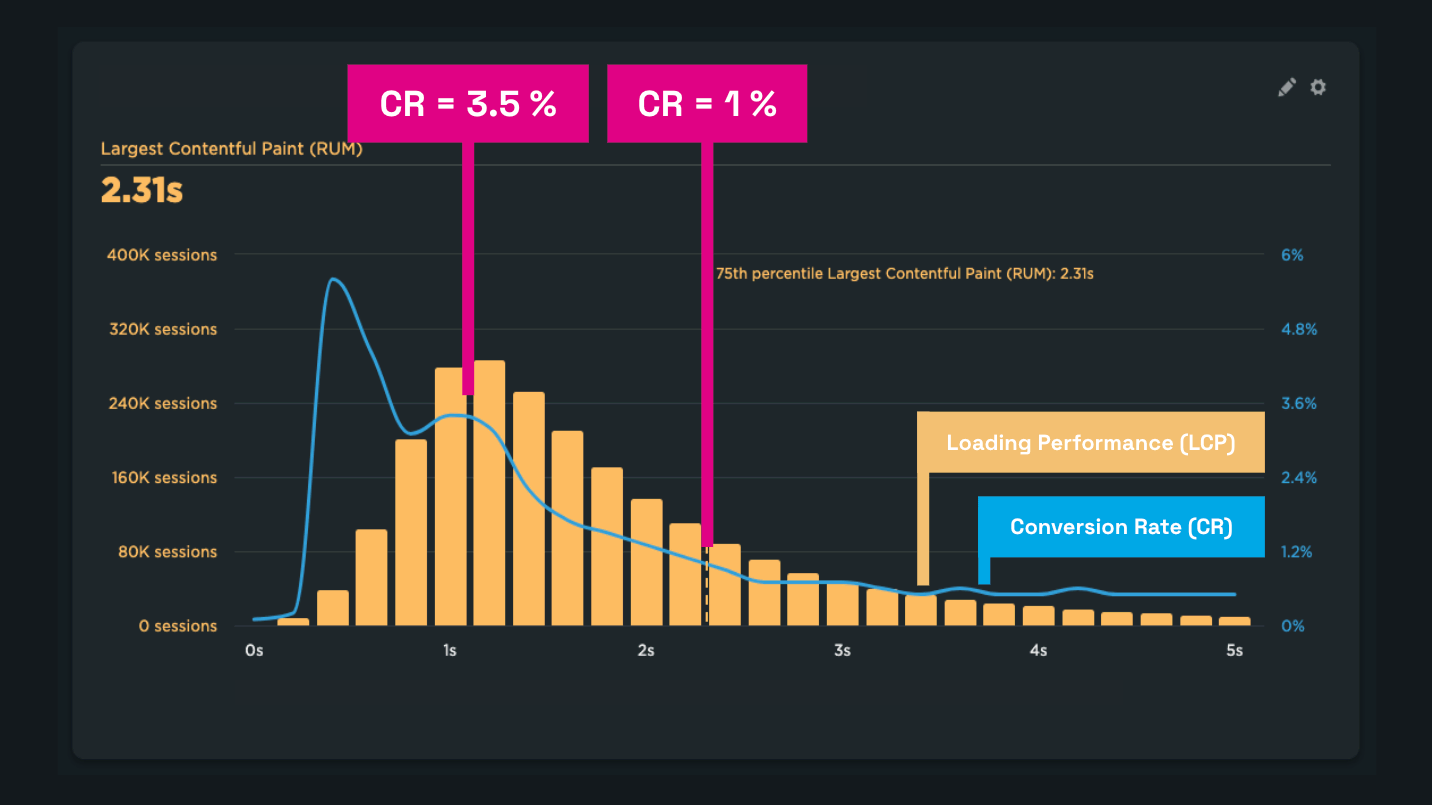 The faster the page loads, the more likely users convert.
In every case, data is essential to achieve these wins. Without monitoring you’ll know there’s a problem but won’t know why.
Fumbles caused by missing monitoring
You might assume site speed is stable because you haven’t touched anything that could affect it. More often, the opposite is true.
Speed changes continually, usually for the worse. In our consulting work we often see Core Web Vitals worsen even after seemingly innocuous changes:
- For Innogy, monitoring caught a surprising INP degradation after deploying Server-Side GTM. Data-driven guidance helped the client and their analytics vendor address specific issues.
- Monitoring lets us warn clients like Dr. Max shop in time when CLS stability deteriorated due to a page issue.
- Monitoring revealed a TTFB degradation on a large e-commerce platform, giving clients concrete data to escalate with support.
- In a Czech podcast, a story about misjudging the cause of a performance problem and spending days on a code rewrite—while the real issue was a single configuration line.
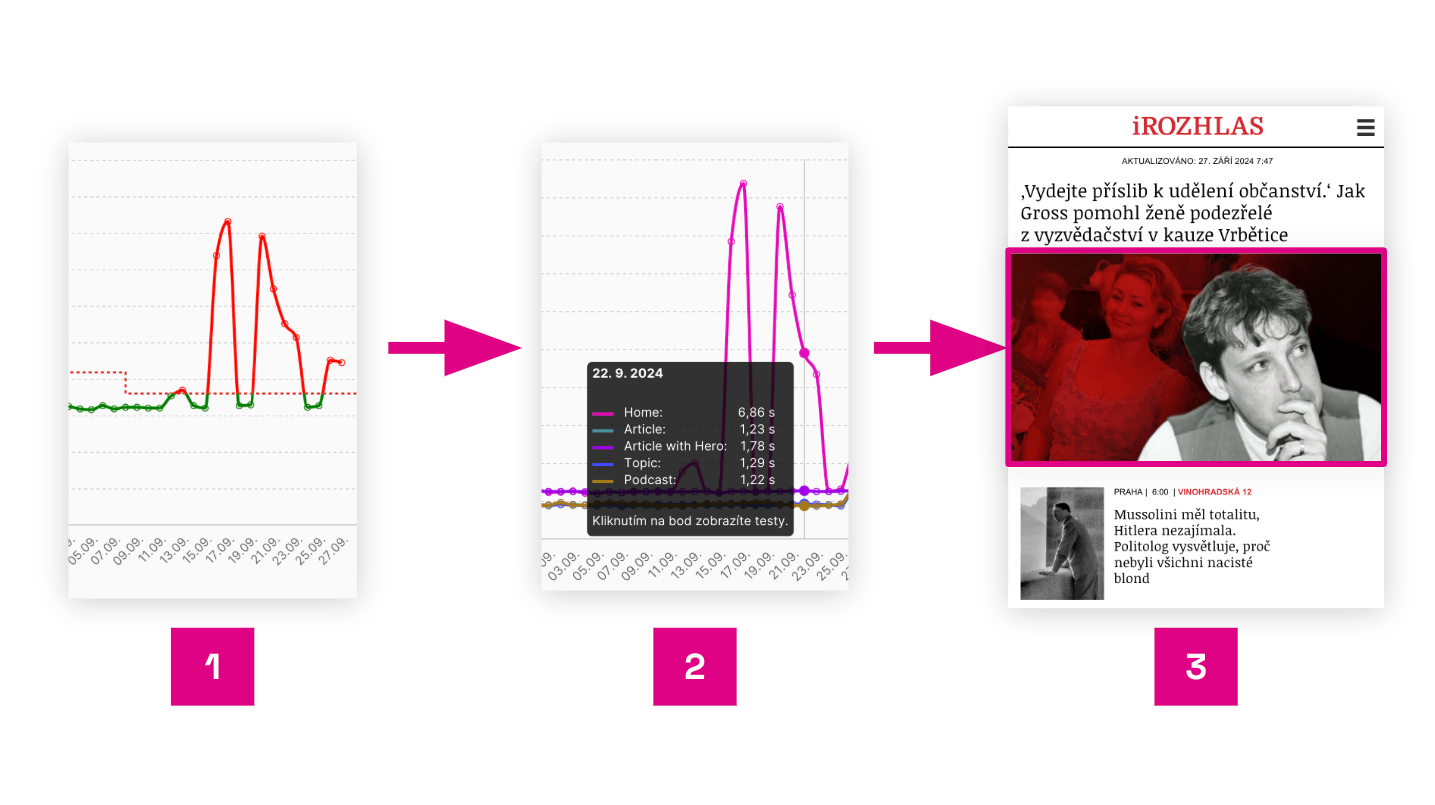 A typical monitoring report from our platform shows the causes of changes and points to the exact page area.
The image shows an example from the [PLUS PageSpeed.cz Monitoring] for iRozhlas.cz homepage, where a wrong image lazy-loading setting caused the problem:
- Synthetic data from [Hlídač] points to an LCP issue.
- LCP breakdown shows it’s a homepage mobile issue.
- A Lighthouse test run detail identifies a misconfigured lazy loading for the first image.
Without monitoring you won’t notice changes. Without monitoring data, tracing the root cause later becomes costly and slows down development.
One-off measurements aren’t monitoring
There are several popular tools like [PageSpeed Insights], [Lighthouse], or [WebPageTest.org] that provide one-off results and technical analysis.
But one-off testing is not monitoring. Continuous monitoring runs automatically at least daily, giving you data over time and enabling you to react to changes you might have missed with ad hoc testing.
Why isn’t it enough to check speed once in a while with PageSpeed Insights?
- You’ll miss many problems.
- You won’t have a data history to pull when needed.
- You won’t see patterns and trends in the data.
- You won’t have data to guide straightforward fixes.
- You can’t celebrate improvements when they happen.
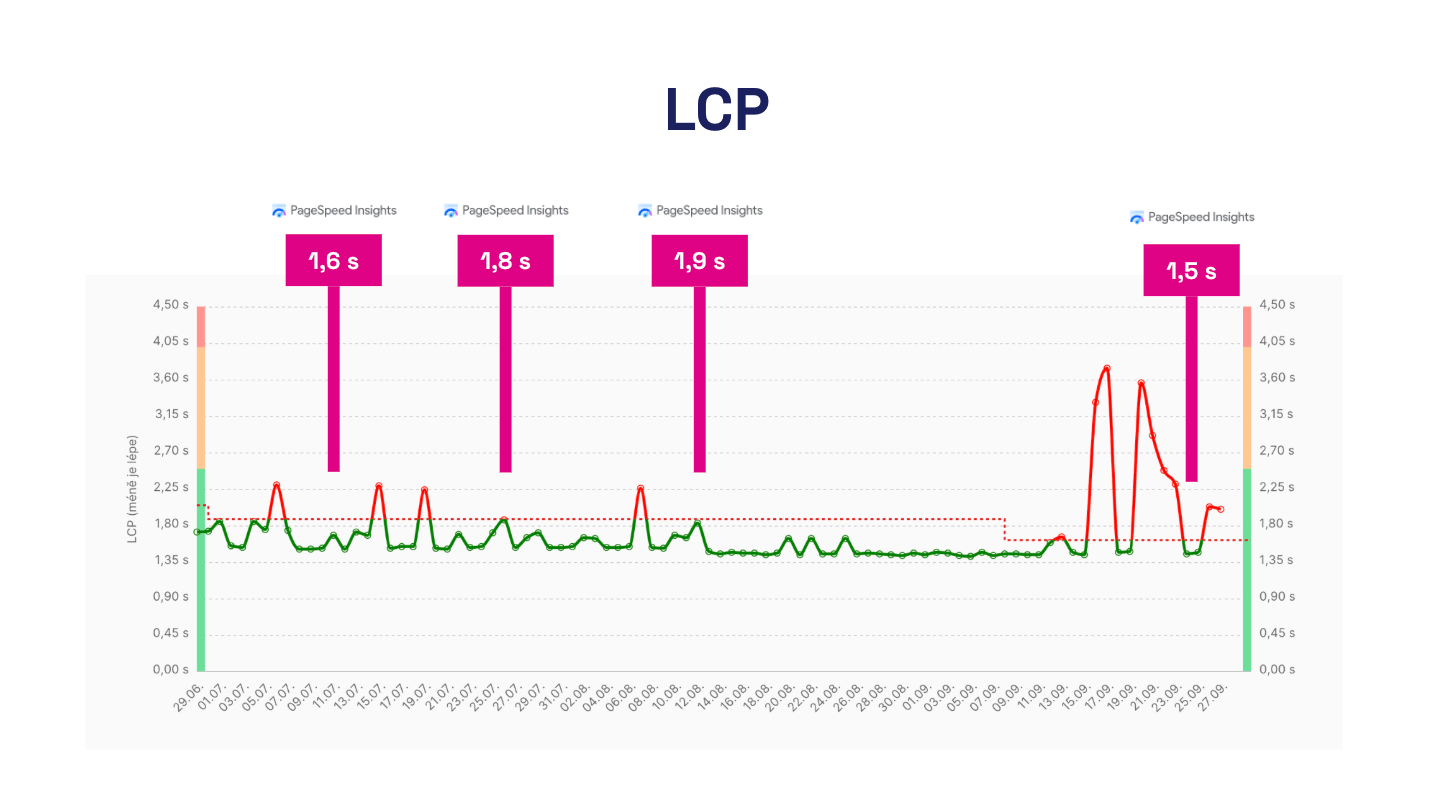 One-off PageSpeed Insights tests you run when you remember them may hide issues or mislead you into thinking speed is improving.
You don’t control site speed, even if you think you do
Fast sites don’t happen by accident—they come from actively preventing slowdown.
Yet speed degradation is common and often rooted in teams having less visibility than they think.
From our experience, monitoring provides clear data that prevents internal debates and points to concrete issues.
Monitoring ROI
In our work optimizing speed for small and large clients, we require speed monitoring as the essential first step to start collaboration.
Few domains in speed optimization offer such clear ROI as monitoring.
For the price of a few dollars a month, you avoid costly debugging and team disputes, potentially saving hundreds of thousands of dollars.
Different kinds of monitoring: you need availability, synthetic, and user data
We often see people confuse several types of web monitoring.
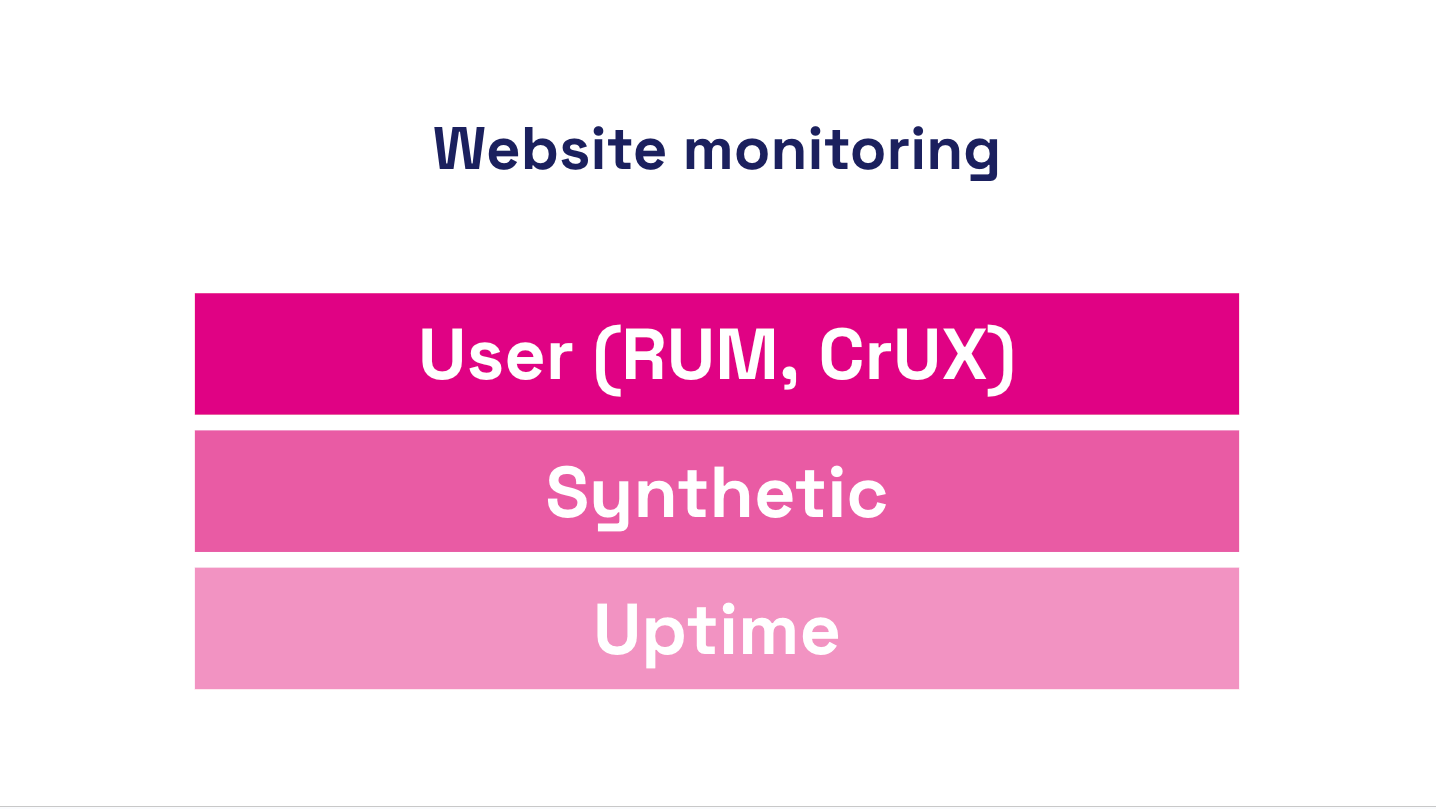 For a healthy site, you need at least three monitoring types: availability, synthetic, and user monitoring.
Let’s sort this out:
Availability monitoring
Answers the question: “Can a bot see if your site is up?”
Availability monitoring tells you whether the site is truly up at every hour, minute, and second of the day. This focuses on technical health and infrastructure.
Examples include [UptimeRobot] and [BetterStack].
Synthetic performance monitoring
Answers the question: “How fast does the site look to a bot?”
This is performance monitoring. Synthetic tests run at set intervals using tools like Lighthouse or WebPageTest. They return site- and domain-level speed metrics but may not reflect user experience (CLS and INP considerations) or may show biased values.
Users experience the site differently than a machine. The advantage of synthetic monitoring is detailed technical data and frequent checks. It’s also used to test performance trends and trigger alerts.
Examples include [Pingdom] and [GTmetrix], though they often target older metrics. Our monitoring PLUS also performs synthetic tests but focuses on Core Web Vitals and adds a user perspective.
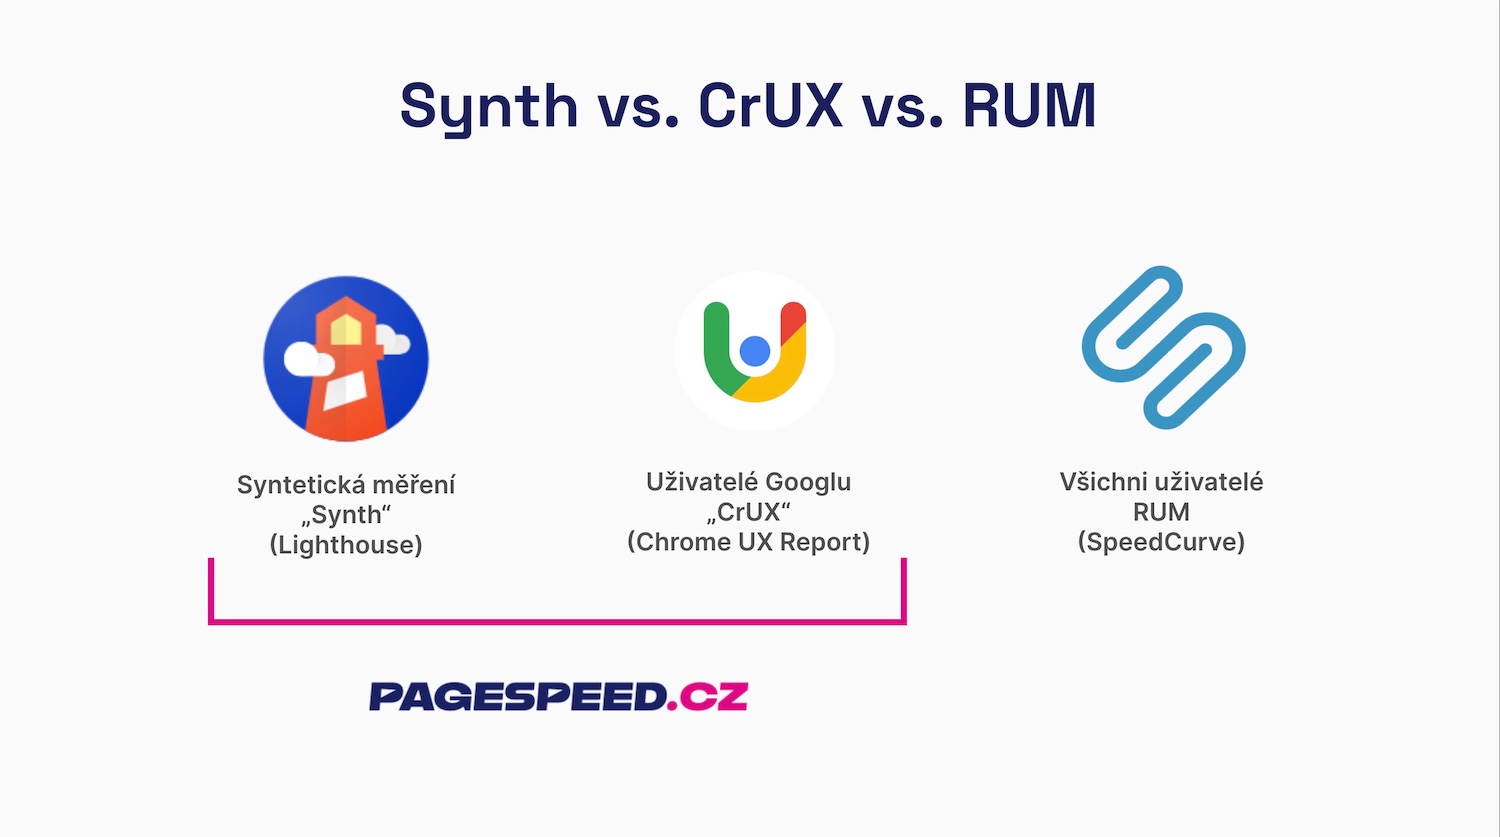 In our view, every site benefits from synth and CrUX data for speed. RUM is valuable, but more relevant for larger sites.
Real-user performance monitoring (RUM)
Answers the question: “How fast do real users experience your site?”
Core Web Vitals and more provide a view of the UX as measured across large datasets.
User measurements come in two main forms:
- Chrome UX Report (CrUX) – Google provides data from real Chrome users for domains or URLs with sufficient traffic. Drawbacks include data latency (rolling 28 days) and limits on detail. The upside is free access. CrUX-based Core Web Vitals influence SERP and Google Ads.
- Real User Monitoring (RUM) – metrics gathered from real users via your own JavaScript instrumentation. Pros: not browser-limited to Chrome, real-time data detail, can monitor private apps behind logins. Cons: more complex setup and higher cost.
Measuring on real users is ideal because you care about real experience. The downside is data availability and depth. That’s why we combine RUM with synthetic data in our PLUS monitoring.
Let’s summarize what we cover here. Availability monitoring checks uptime; synthetic monitoring measures speed in a controlled way; user monitoring provides real-user experience. The ideal setup includes all three.
Tip: Check our comparison of different measurement types — synth, CrUX, and RUM.
Monitoring speeds by audience
It’s interesting that different audiences need different performance data:
- Developers — in addition to site-speed status for users, they need change alerts, diagnostic data (technical metrics) guiding problem causes and optimization opportunities; availability monitoring is standard.
- Web owners, marketers, UX pros — need the current speed status, regular reports, and change alerts; it helps tie speed to business outcomes.
- Agencies — should manage access to multiple projects, receive regular reports, and view project status in one place.
See our article on why monitoring is valuable for development agencies.
Your monitoring tools should deliver what you need to achieve your goals.
Our approach to monitoring performance
We have years of experience advising on site speed for small and large clients across Central Europe. We’ve developed a methodology for setting up speed monitoring that we’re excited to share.
CrUX as a foundation and SPS score as a primary indicator
We view Core Web Vitals as strong speed signals, and CrUX data from real users as a valuable asset for site operators.
LCP, INP, and CLS are not perfect, but they reveal the major aspects of user experience. CrUX data isn’t perfect for every scenario, but it’s a solid baseline for any reasonably sized site.
CrUX data also supports the two main speed optimization drivers: user experience (UX) and search-driven traffic (SEO and PPC).
For clients, our monitoring baseline starts with the current values of these metrics:
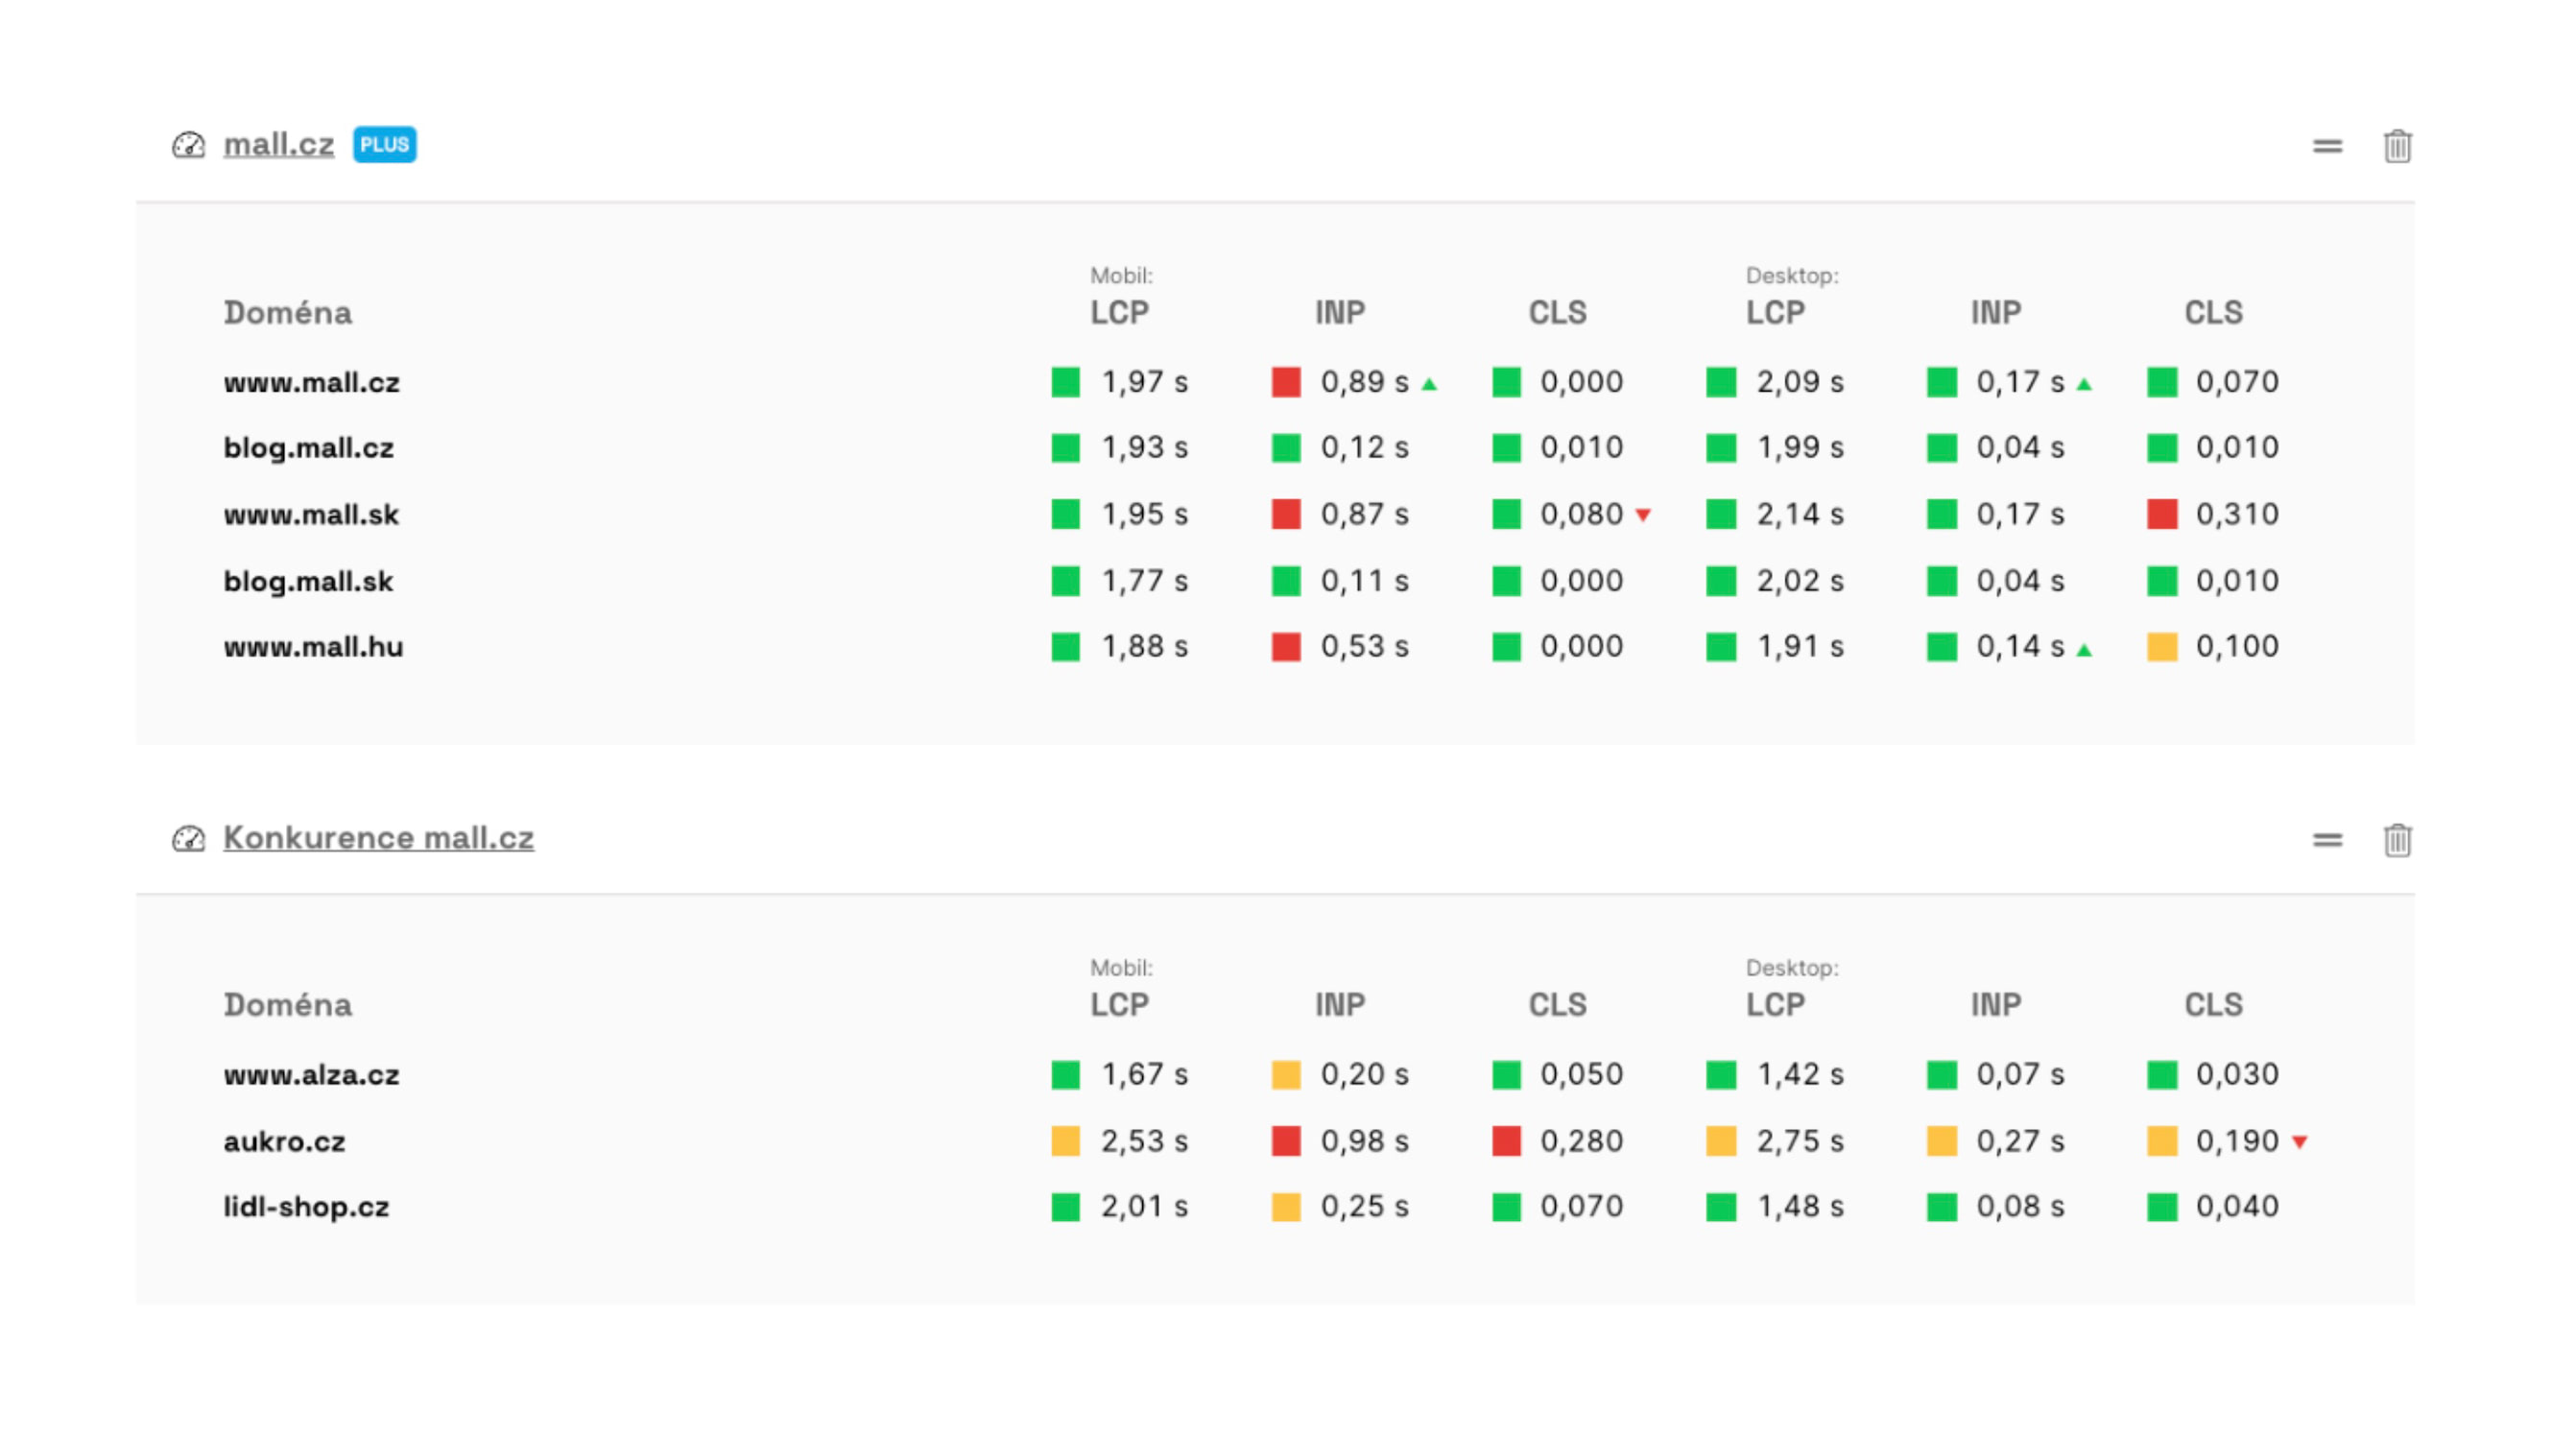 Our monitoring provides metric evolution along with current values.
We track three metrics across two devices, which means six metrics to remember per domain. To simplify, we added a composite score—the PageSpeed.cz Score (SPS):
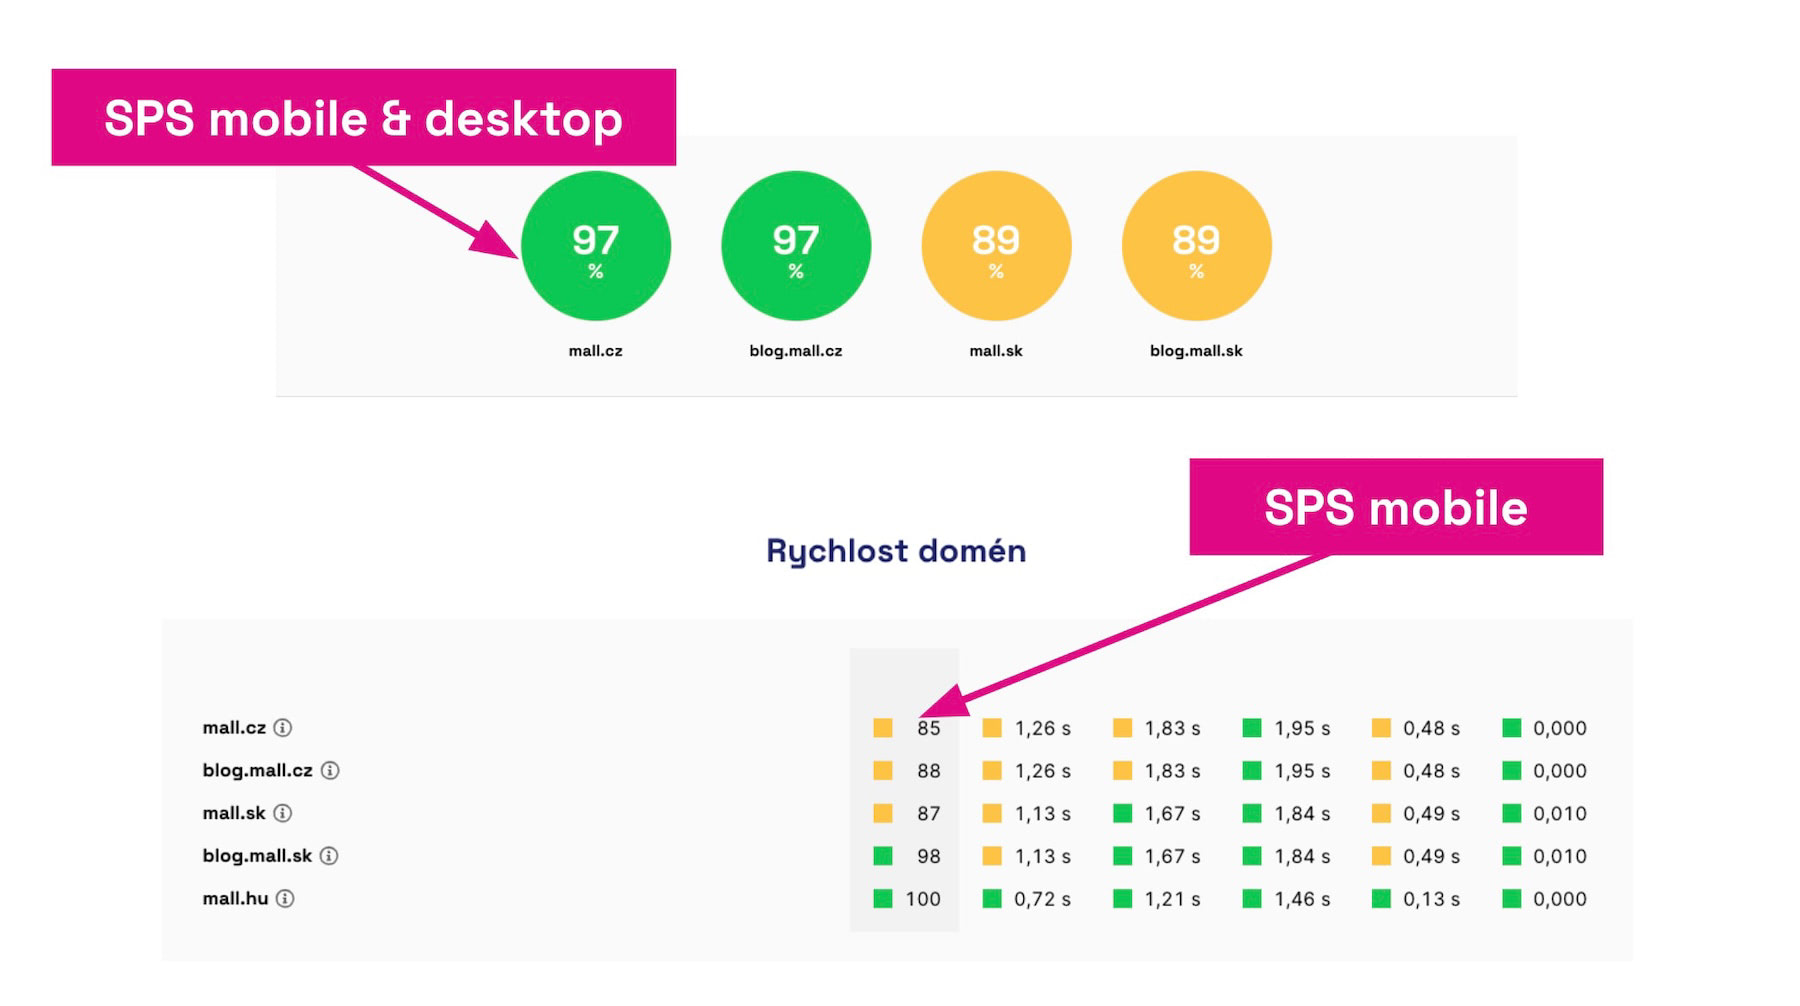 The SPS score offers a quick snapshot of overall site speed.
For smaller sites, data volume on a client domain may be limited, so synthetic measurement is essential.
Daily synthetic measurements
Synthetic testing with Lighthouse is a vital complement to CrUX data. Data is broadly available and provides up-to-date metric readings.
We experimented with multiple daily runs but settled on daily testing with a three-day alert cycle to catch changes via our [Hlídač] (Watchdog).
Pragmatically, most clients optimize speed on a weekly-to-monthly cadence. Alerts for hourly swings are typically too noisy. We’ve found this approach works well for most sites.
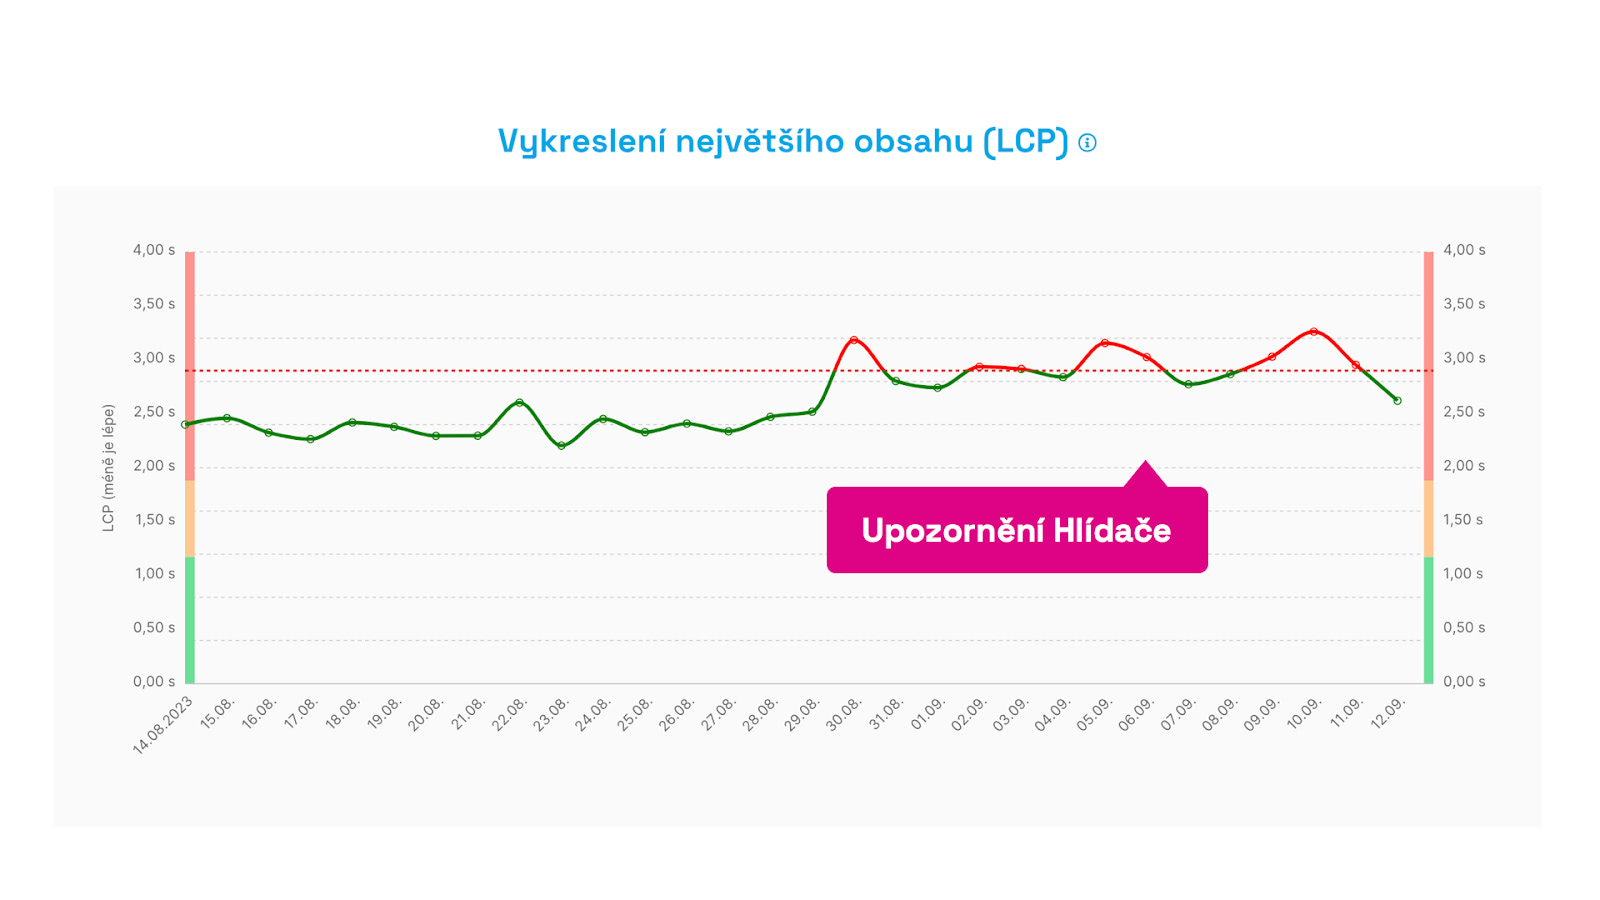 Hlídač alerts don’t trigger for a one-off spike, but after three days of sustained change.
For larger sites or during performance swings (Black Friday, etc.), we enable RUM measurements temporarily.
RUM monitoring for large clients or during optimization
Having data from all users (RUM) sounds great, but it can overwhelm and complicate interpretation. RUM isn’t trivial to set up and can be costly.

We offer help with implementing SpeedCurve RUM and enable RUM for smaller clients when we’re actively optimizing or during seasonality that could affect performance.
RUM is also recommended for monitoring private web apps like SaaS.
Where to monitor: production, staging, etc.?
Where should you run monitoring? Production only? Staging or test environments? Local development or CI/CD pipelines?
Best practice: monitor at all levels.
In reality, production monitoring is essential. Stage environments are often unstable and don’t reflect real traffic. A pre-production environment is ideal, but not all firms have that.
Ideally, monitor everywhere, but if that’s not possible, focus on production.
CI/CD and local testing are important too, but developers and testers don’t have user data (CrUX or RUM). Localhost often isn’t stable, so synthetic data may not be comparable.
Pragmatic answer: monitor primarily on production, and make it easy to roll back problematic releases with hotfixes.
Give special attention to notifications
Good performance monitoring communicates well. Too many alerts, false positives, or noisy signals lead to alert fatigue.
Performance-monitoring apps often require manual tuning of Performance Budgets, which takes time and attention.
Hlídač notifications can be sent to Teams, Slack, or email.
Our Hlídač alerts are designed to minimize noise. We only alert when deterioration isn’t a one-off event. We auto-tune limits for metrics according to best practices we’ve developed over years of experience.
We also provide guidance on how to interpret Hlídač alerts and the technical data needed to pinpoint root causes.
In summary
- Measure speed with continuous monitoring rather than one-off tests.
- Realize the ROI of monitoring; it saves time and money and helps you fix issues faster.
- Use the right mix of monitoring types: availability, synthetic, and RUM.
- Set up alerts and use them to guide improvements.
- See how monitoring helps with backend optimization too.
Demo request
Schedule a demo of our monitoring
We’ll show how speed monitoring helps you identify and fix issues faster.
Monitoring speed is not a sprint; it’s a marathon. Ongoing effort to improve UX and SEO/PPC rankings requires a data-driven partner.
Case study: redesign of Světla World
Learn how data from monitoring helped in the Světla World redesign. For clients with stable speed, we measure synthetically and with CrUX data; for major changes we run full-blown RUM measurements to capture real-time data just before the redesign launch.