Chrome UX Report: Real-User Speed Data from Google
Chrome UX Report (CrUX) is a public data set provided by Google that collects and anonymously analyzes data about real user experiences when browsing the web with the Chrome browser.
 The Chrome UX Report logo from Google.
CrUX focuses on key metrics such as loading speed, interactivity, and content stability. It provides valuable insights into how websites perform under real-world conditions. CrUX data are, by nature, different from RUM or synthetic measurements.
Why is this important and where is it used exactly?
CrUX is a crucial resource for developers, SEO professionals, and digital marketers because it offers a view of data from real users. From our experience, we’ve most often seen speed impact:
- SEO: Google includes Core Web Vitals in ranking web pages in search results. Better performance can lead to higher rankings.
- PPC campaign evaluation: Website speed influences bounce rate and overall PPC performance. Speed can also affect Google Ads costs.
- Speed measurement: CrUX provides real-world page load data, enabling developers to improve user experience. By analyzing this data and optimizing, you can speed up your site and increase user satisfaction. You can also compare your site to competitors.
There are many more arguments, but we’ve covered them in a separate article Why page speed?
How is it measured?
CrUX collects data directly from Chrome users who have not opted out of sharing usage data.
Google collects data separately for mobile, tablet, and desktop. CrUX includes information about Core Web Vitals metrics, including:
- Largest Contentful Paint (LCP)
- Interaction to Next Paint (INP)
- Cumulative Layout Shift (CLS)
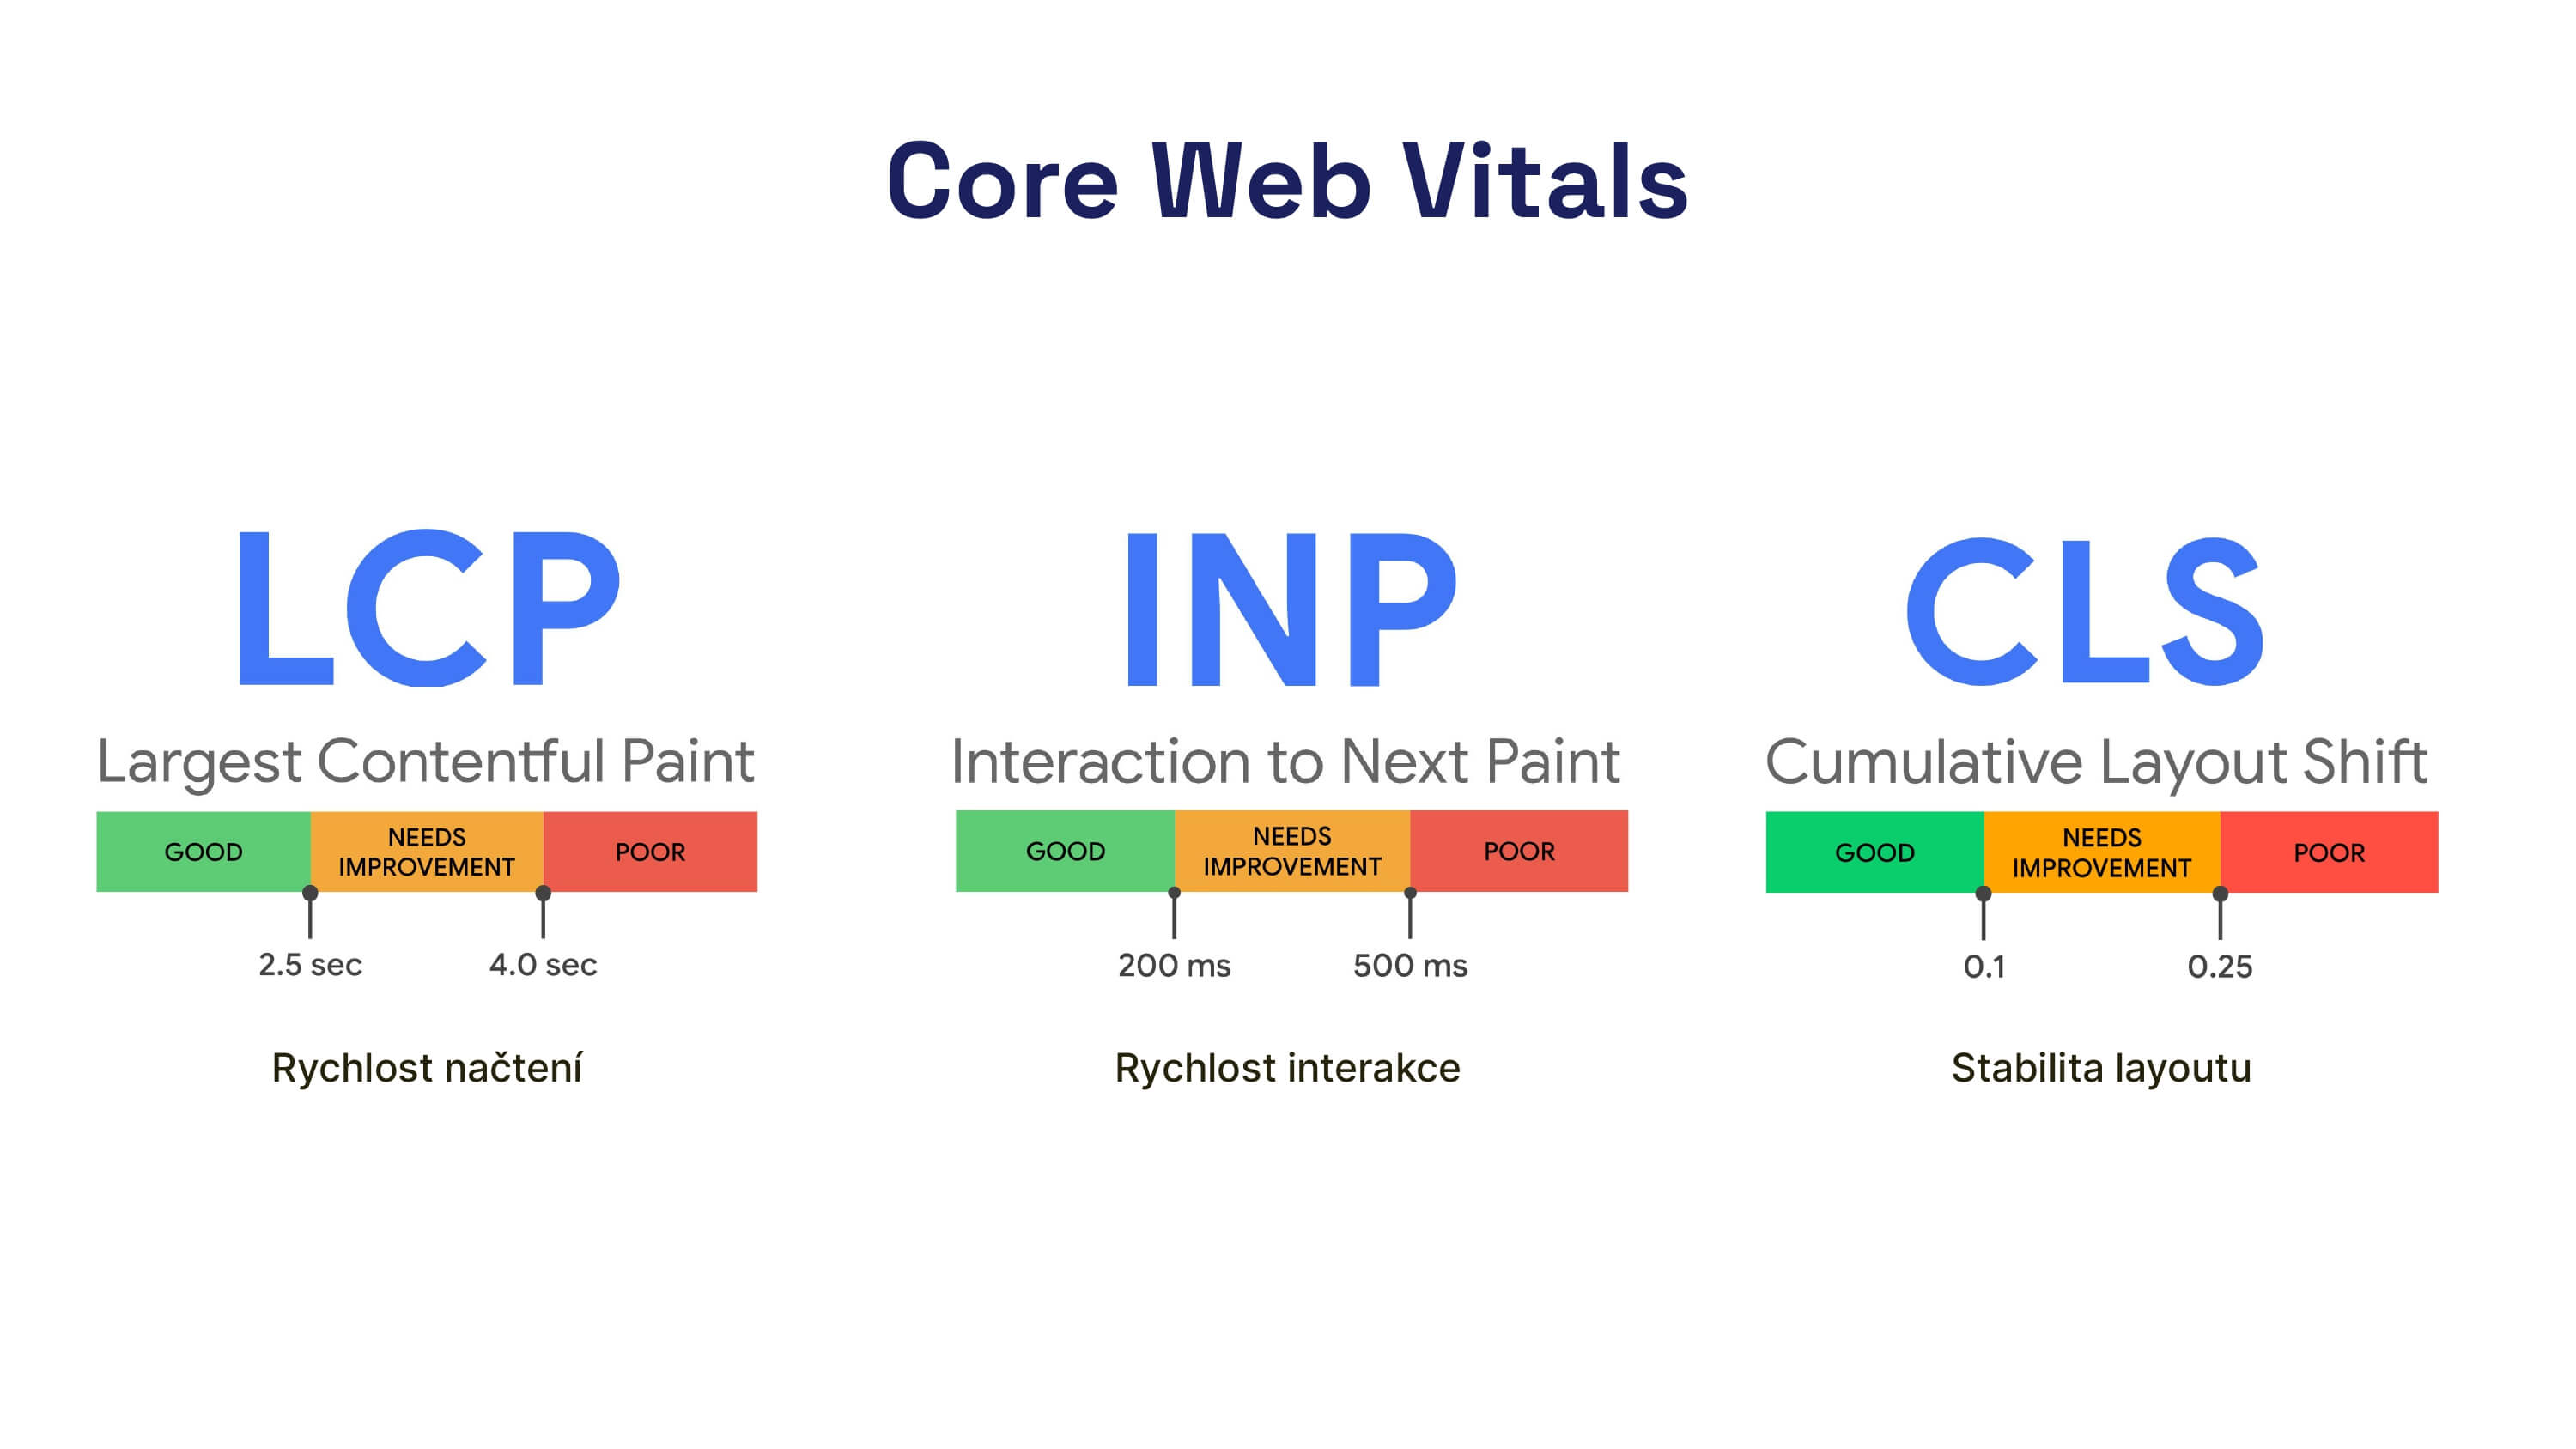 Core Web Vitals metrics: the essential speed metrics.
In addition to these metrics, CrUX also contains data for other metrics and events, specifically:
- First Paint (FP)
- First Contentful Paint (FCP)
- DOM Content Loaded
- Onload
There are also experimental metric values:
- Backend latency (TTFB)
- Popularity
- Notification Permission
- Roundtrip time (RTT)
We must also not forget about navigation types, which help us understand how users access our pages and how they behave.
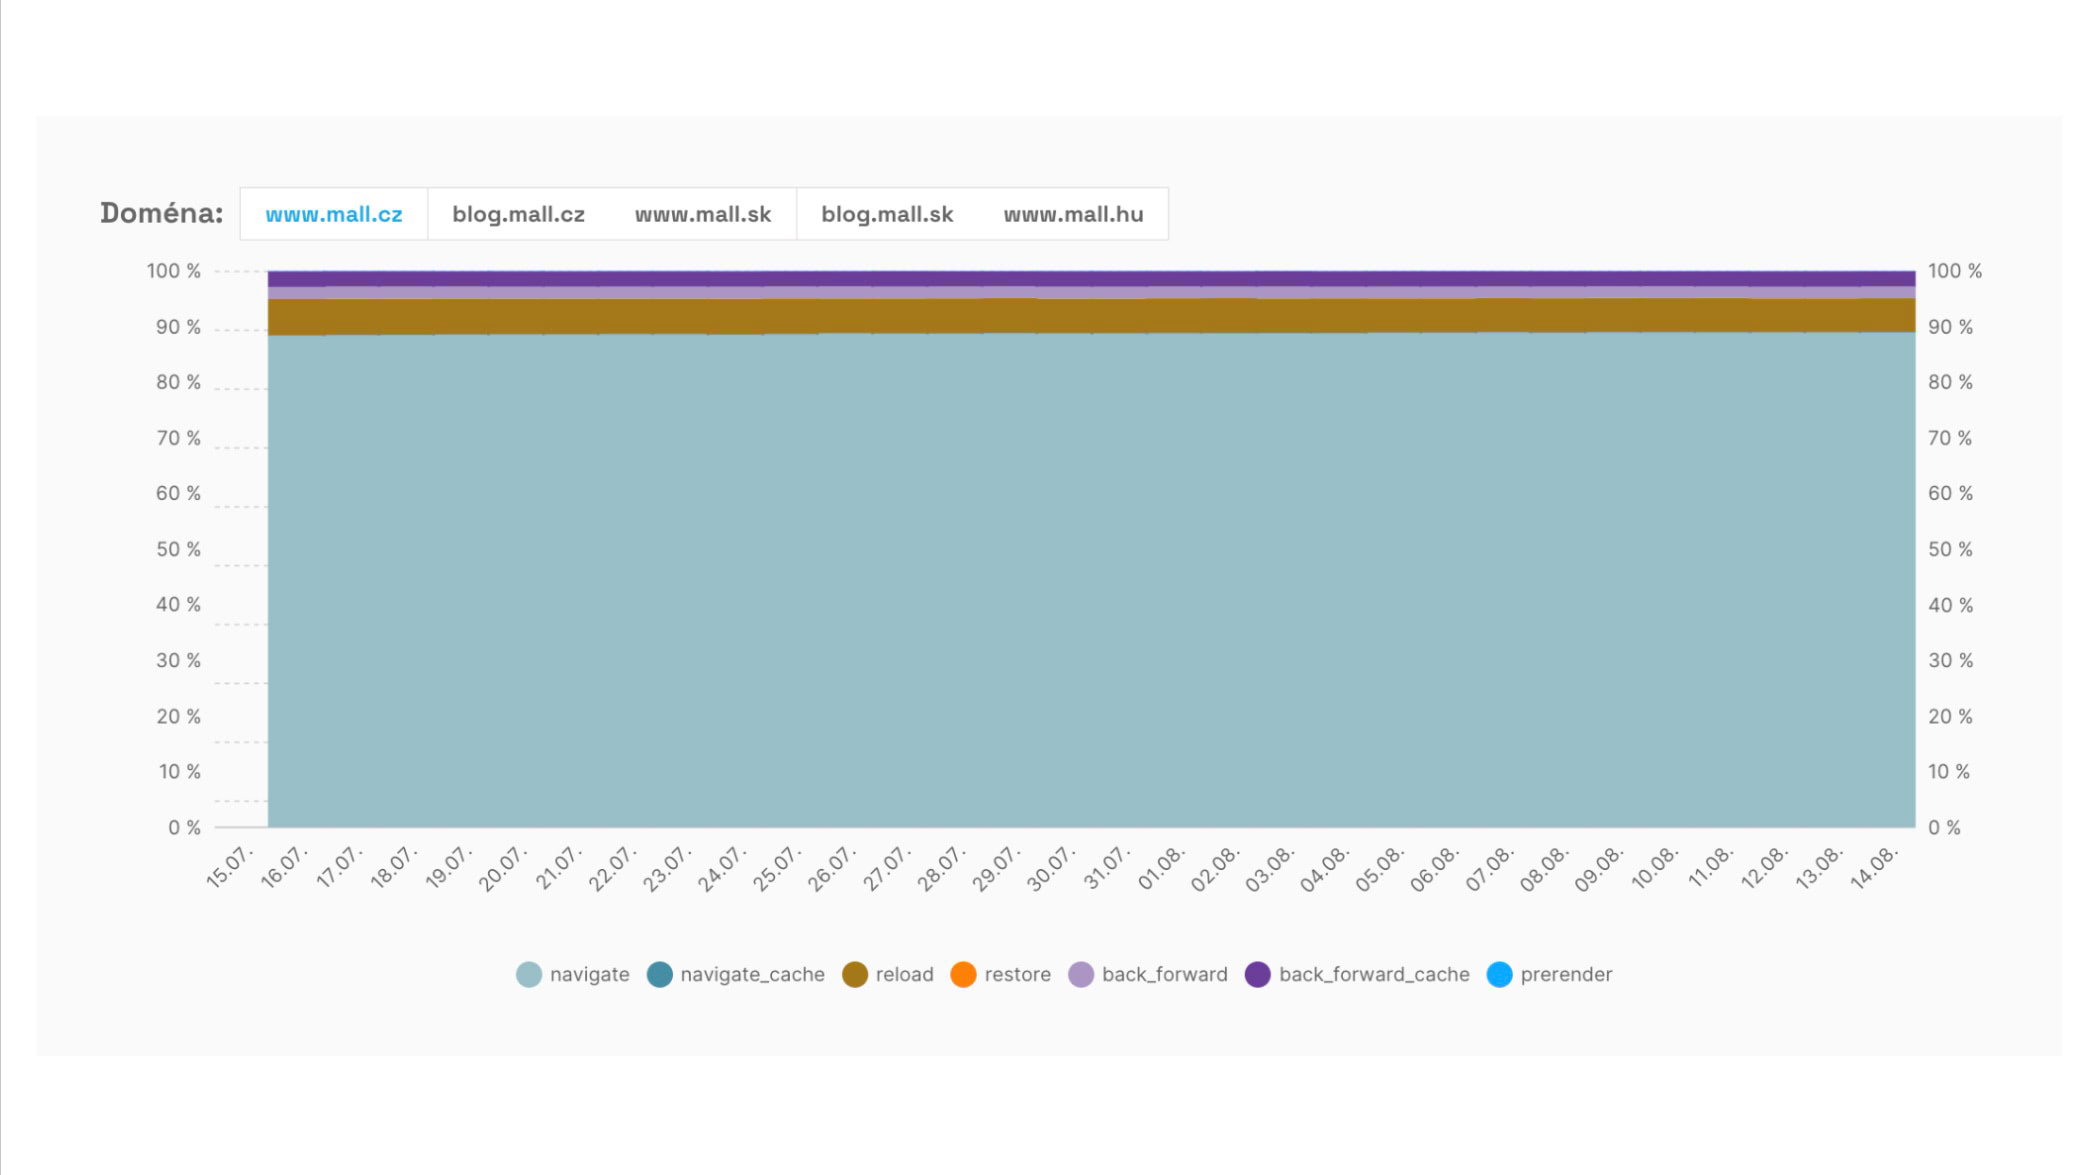 The evolution of the share of navigation types helps reveal fast or instantaneous navigations such as BFCache or prerender (with Speculation Rules).
Data are aggregated at the page and domain levels and also include information about connection speed, region, etc.
Domain and URL-level data must have sufficient traffic for CrUX data to appear. Based on our consulting experience, you’ll typically need roughly 10,000–15,000 page views per month for the entire domain or for a given page.
Where can you find CrUX data?
Google offers a range of tools to work with CrUX. Each accesses the data a bit differently, so metric support and currency may vary.
- Google BigQuery - The public CrUX dataset enables advanced analysis via SQL queries.
- PageSpeed Insights - Allows one-off speed tests and provides CrUX data. Includes page- and domain-level analyses for the last 28 days.
- Google Search Console - Shows CrUX-based reports, primarily aggregated URL groups with problematic Core Web Vitals metrics.
- Monitoring PageSpeed.cz - In our tool we work with advanced CrUX data views, using the CrUX API. Our tool includes an overview of Core Web Vitals history for domains, individual URLs, a graph of navigation type distribution, and much more.
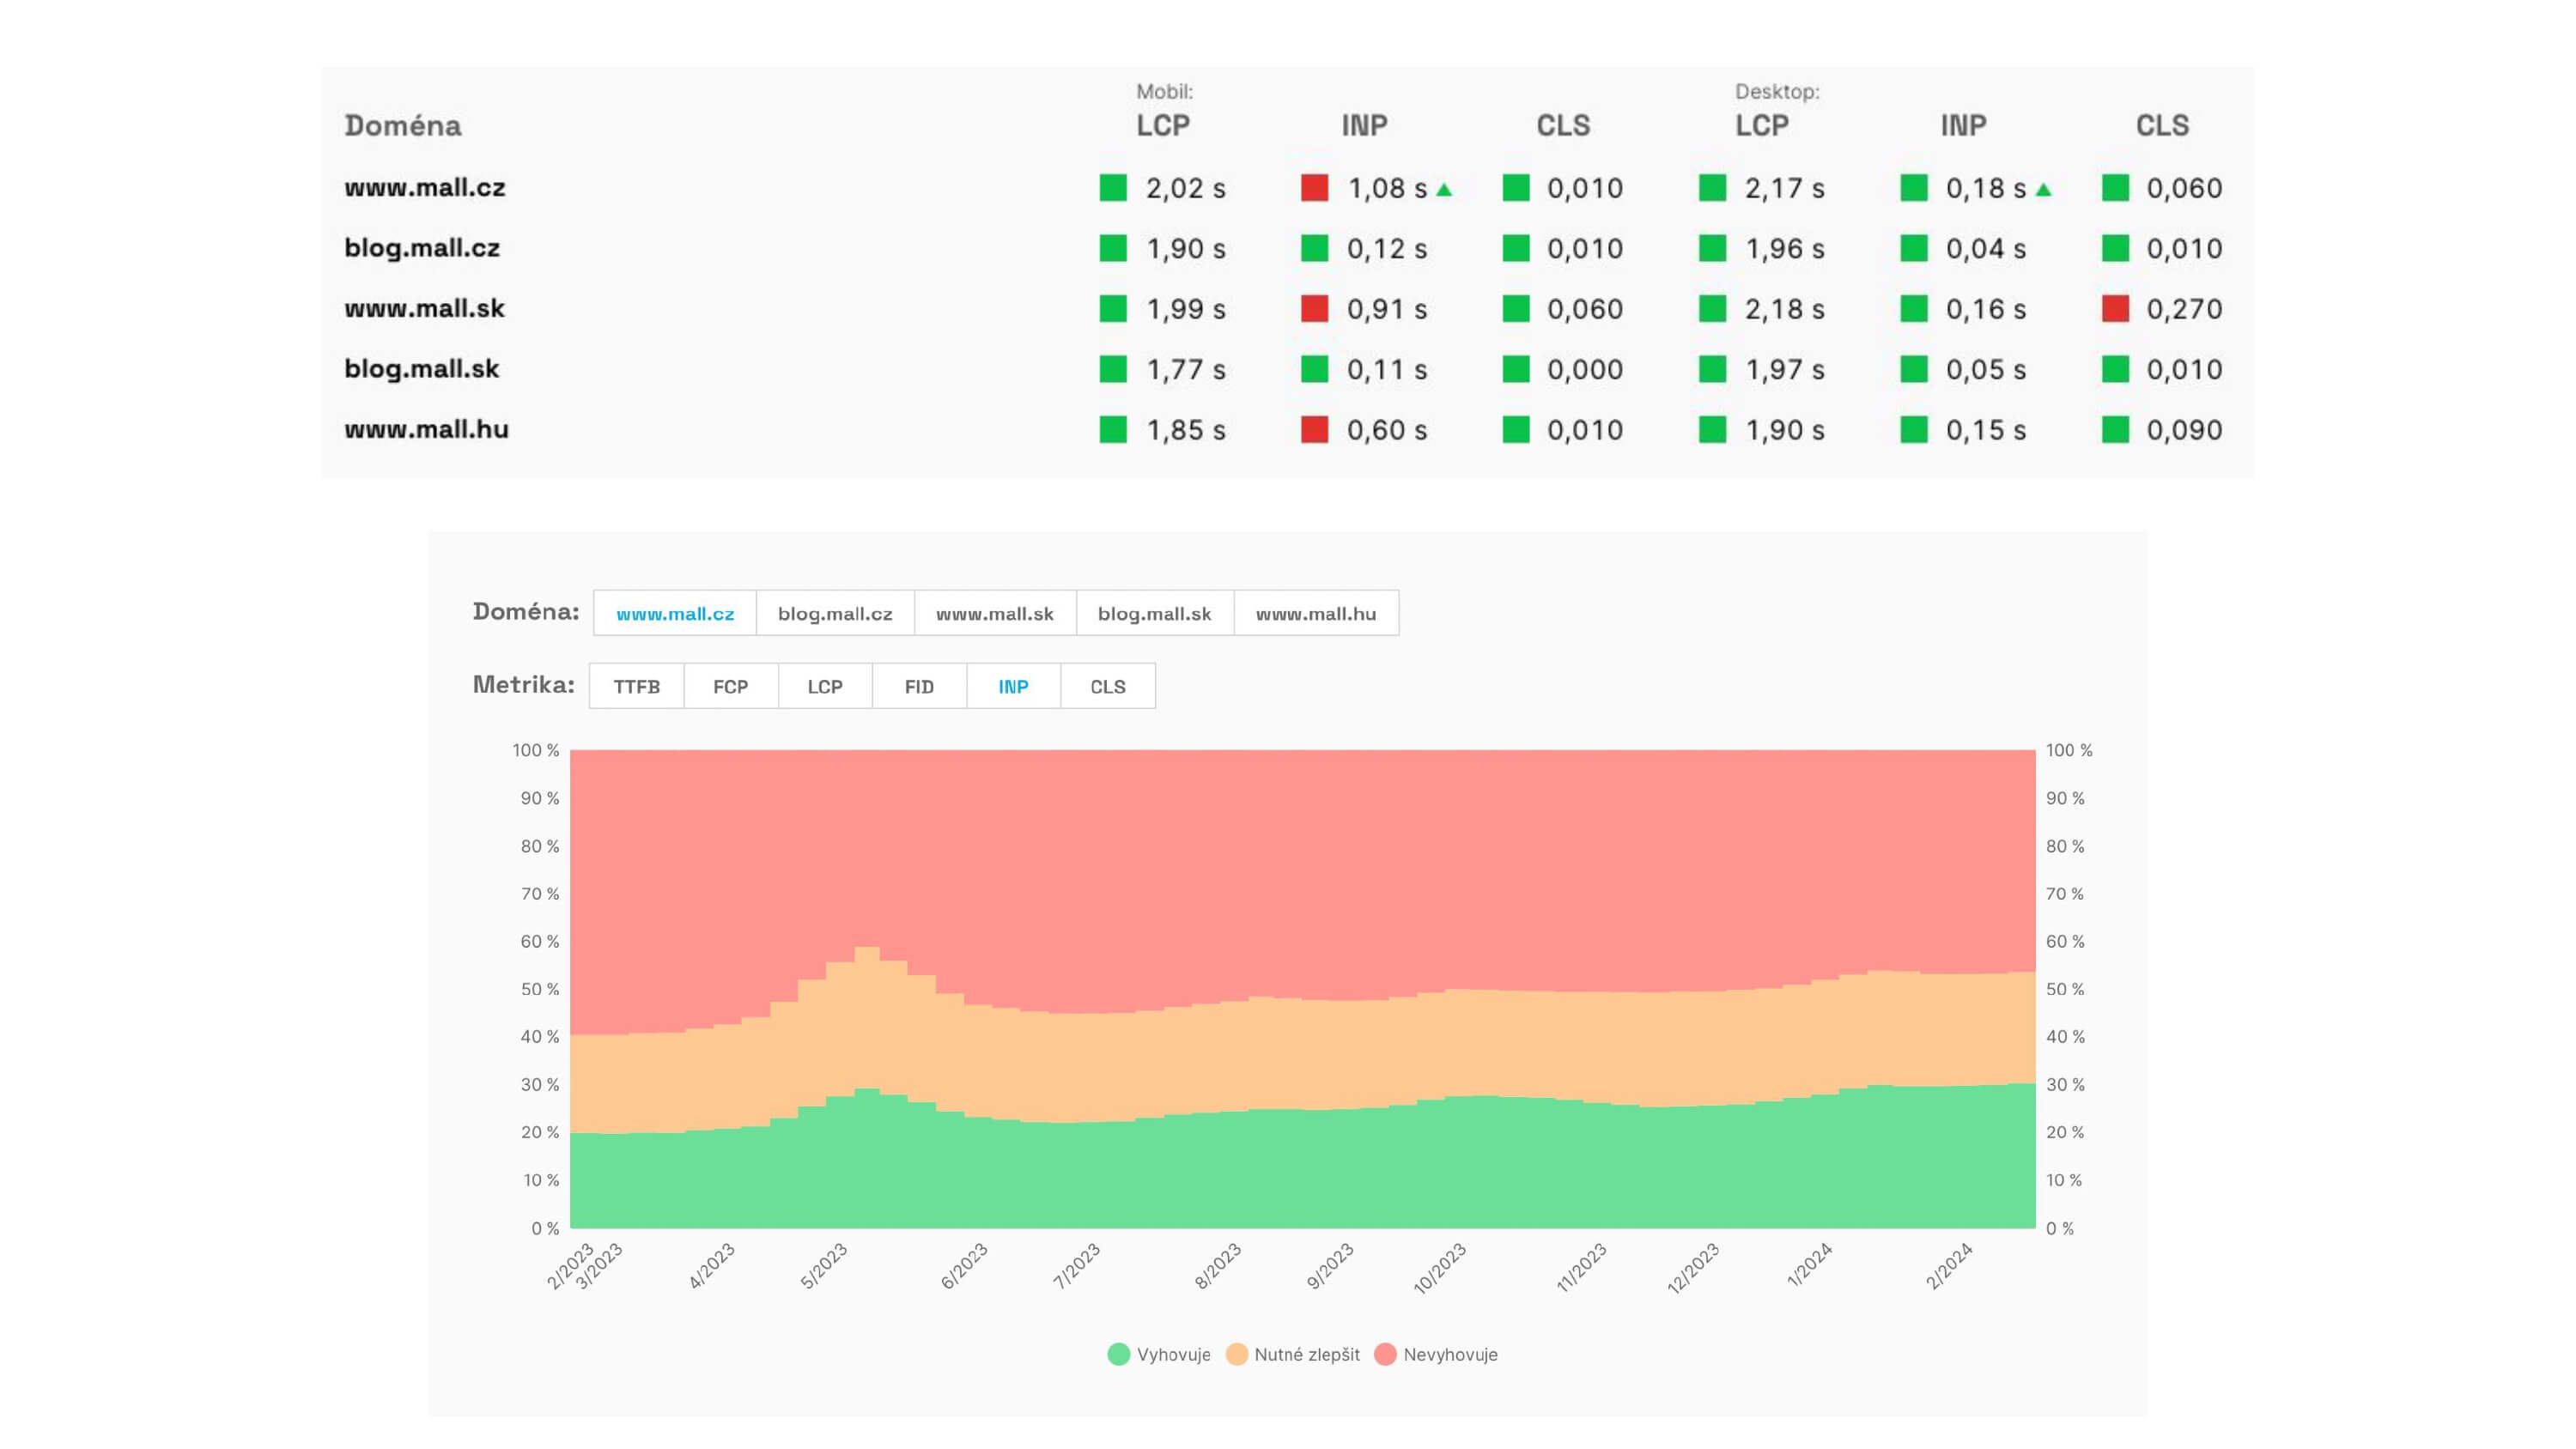 CrUX data reports from the PLUS monitoring show metric status on domains.
Tracking CrUX data is important for all sites that have CrUX data. We recommend monitoring Core Web Vitals primarily at the domain level and, secondarily, on key entry pages.
More information about the Chrome UX Report can also be found in the official documentation.